AutoResp™ v3 usercase: DTU Aqua, Hirtshals, Denmark
AutoResp™ v3 usercase: DTU Aqua, Hirtshals, Denmark
Wed, Sept 20 2023
Upon launching the new AutoResp™ v3 software for Windows 11, we had the opportunity to visit Dr. Peter Vilhelm Skov at DTU Aqua’s facilities in Hirtshals, Denmark.
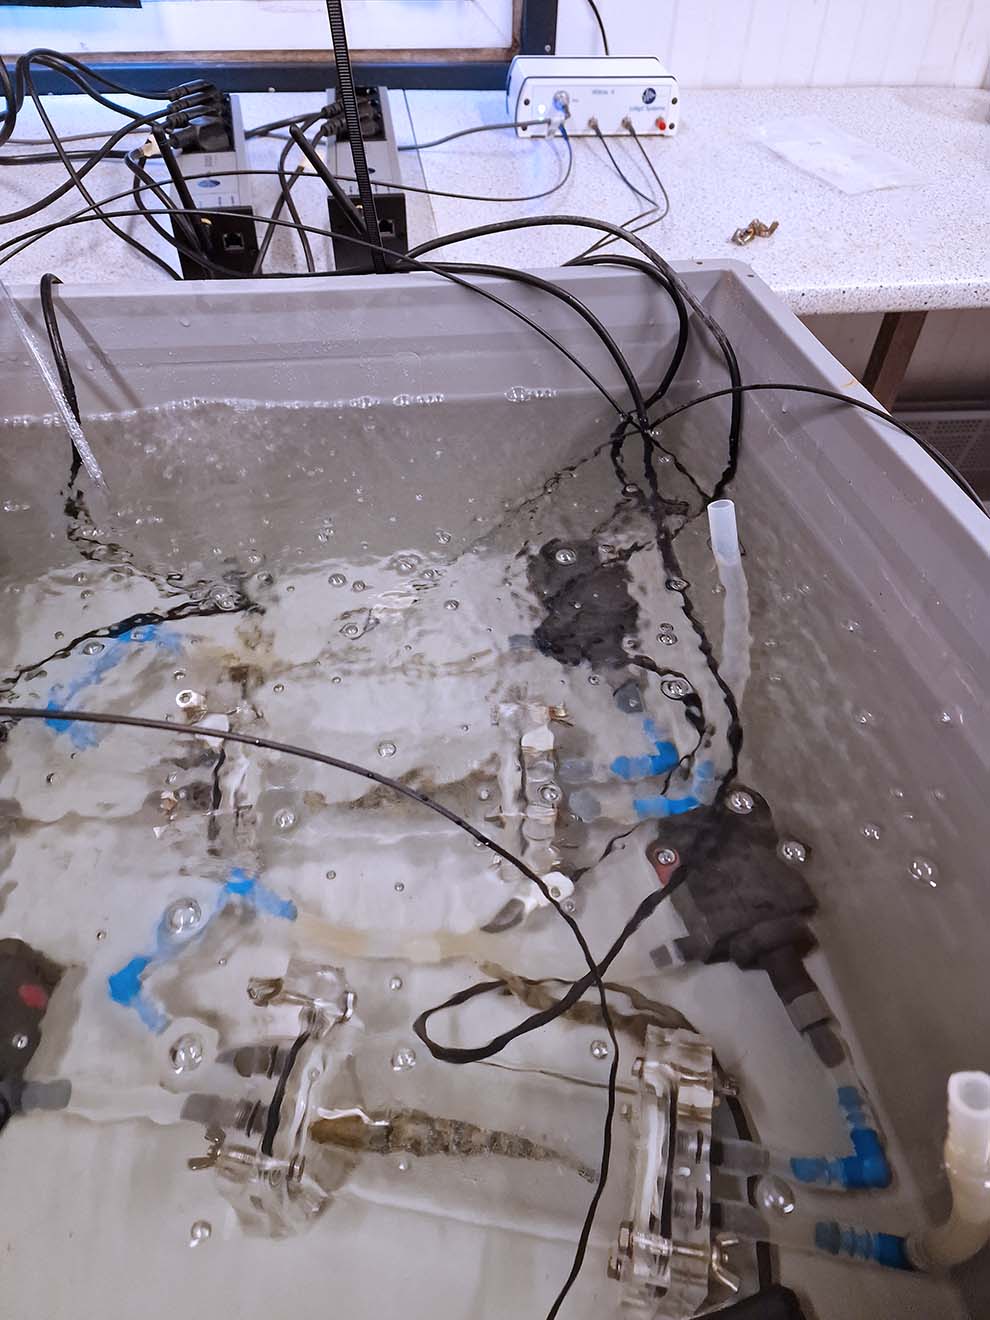
Peter and his post doc, Dr. Tilo Pfalzgraff, had rigged up an acrylic resting chamber system ready to use with 21-33 g juvenile rainbow trout. The trout were each placed inside 500 ml acrylic chambers connected to flush and recirculation pumps. Each pump was controlled independently for using two PowerX4 power strips, and each chamber setup was fitted with an oxygen sensor connected to the Witrox 4 oxygen instrument. All the chambers were submerged in a water bath with climate-controlled freshwater running through it to keep everything at a stable 15.3 °C.
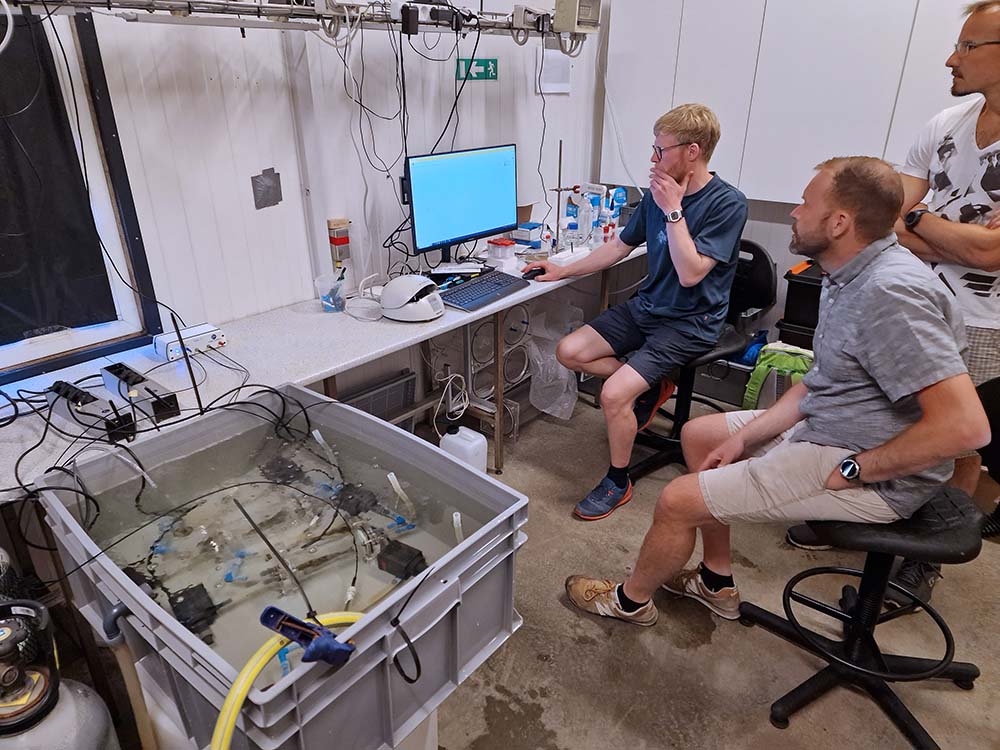
Upon completing the setup and oxygen sensor calibration, and making sure each fish had a steady supply of fully air saturated water, Peter and Tilo received a thorough introduction on how to use the many new features in AutoResp™ v3.
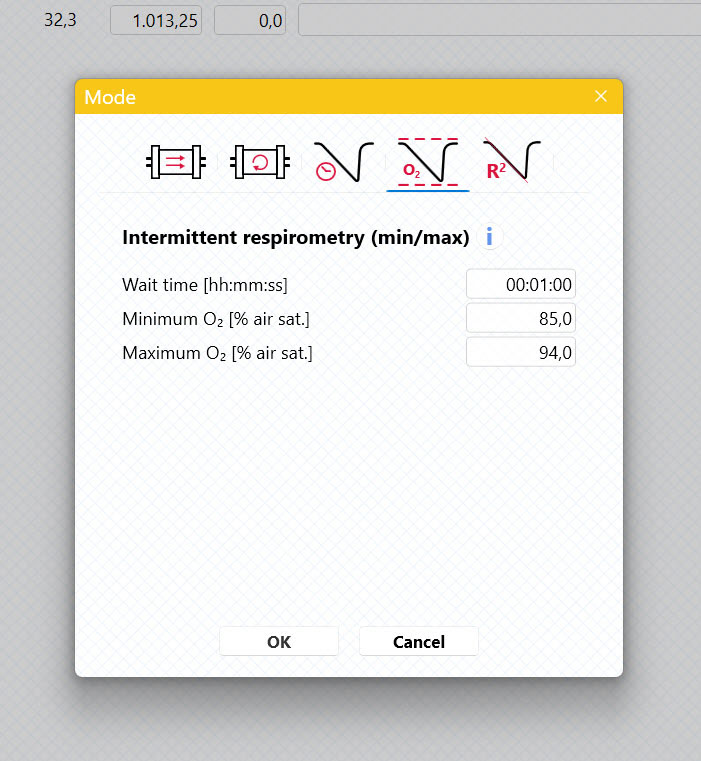
One of the new features introduced in AutoResp™ v3 is the Min/Max intermittent respirometry mode. This mode allows the user to set a minimum and maximum % air saturation level while running the standard intermittent phases of flush, wait, and measure. In the rainbow trout experiment here, we wanted to measure MO2 values while the % air saturation was dropping from 94 % air saturation down to 85 % air saturation after which the flush pump would turn on and increase the % air saturation level in the chamber back up to 94.
After entering the required setup information like intermittent respirometry mode settings, fish weight, atmospheric pressure etc. in AutoResp™ v3, the data logging was initiated in each chamber. Another new feature is that since each chamber had its flush and recirculation pump controlled from individual relays on the PowerX4, each chamber was controlled and logged individually. And after about an hour of data logging, the experiment was ended and the three AutoResp™ v3 data files were loaded directly into the AutoResp™ v3 Analysis menu.
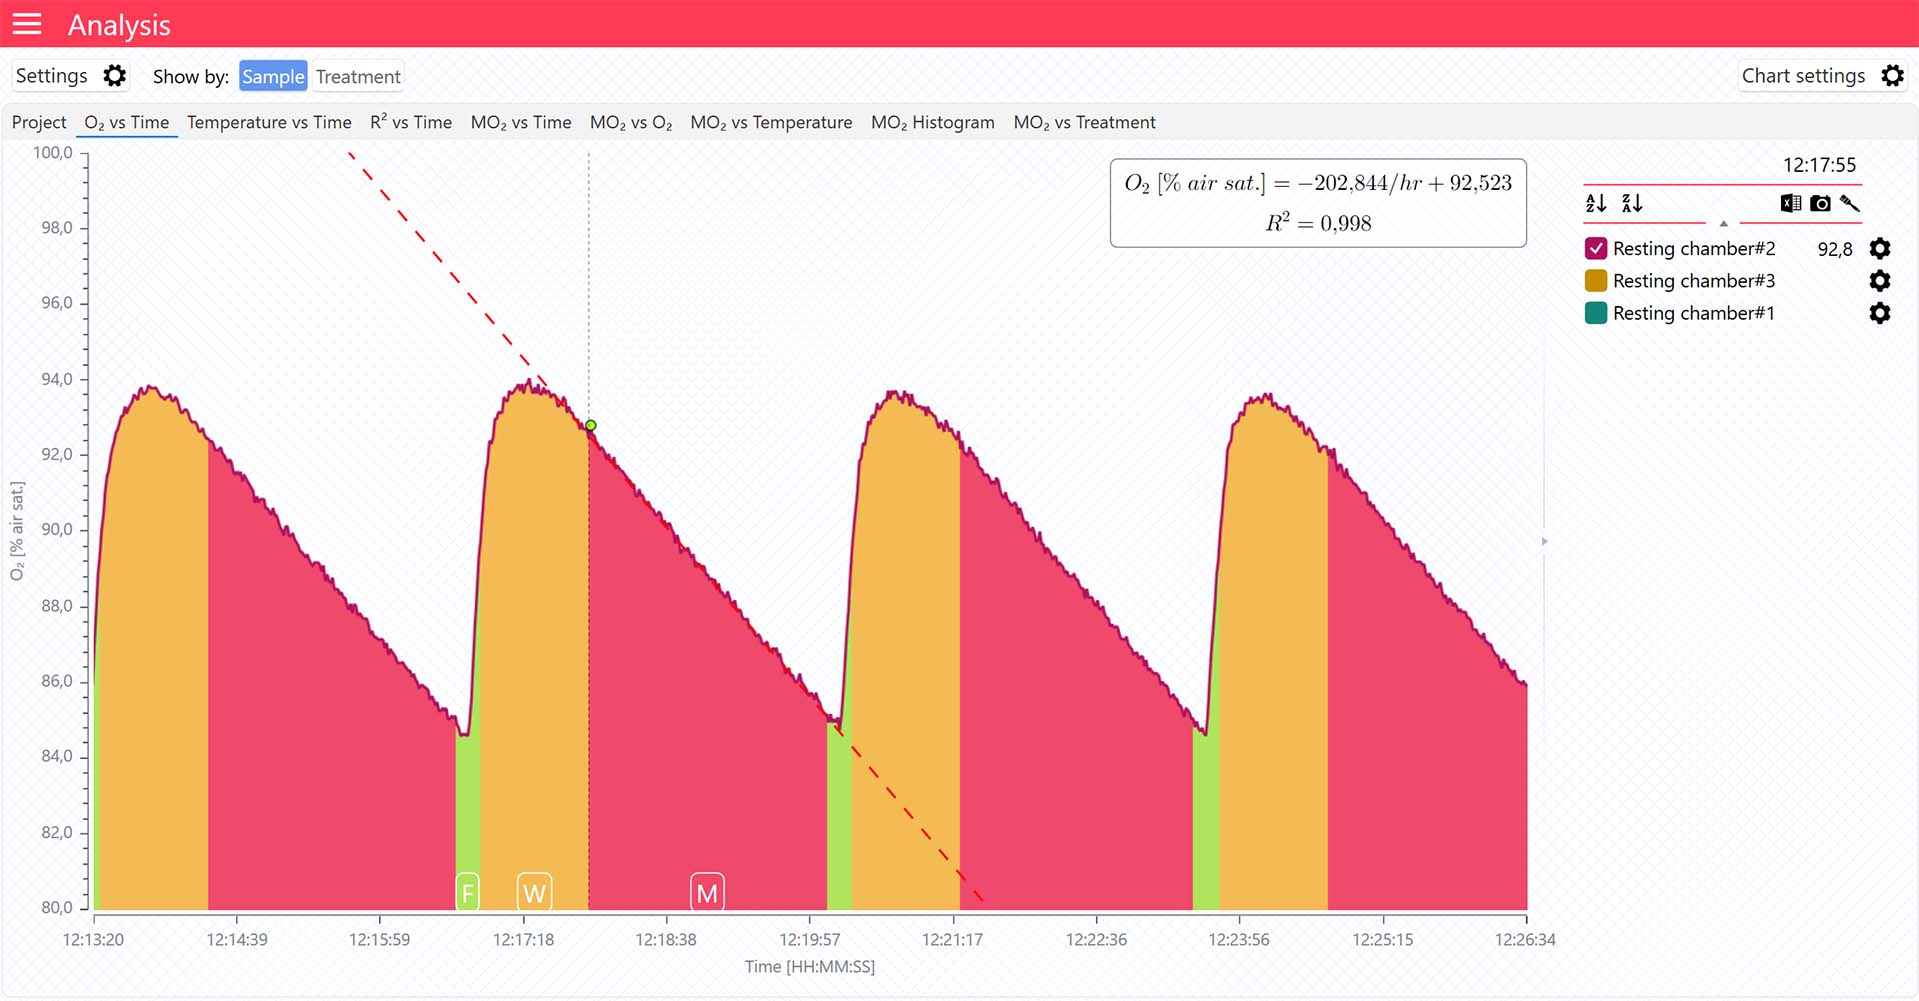
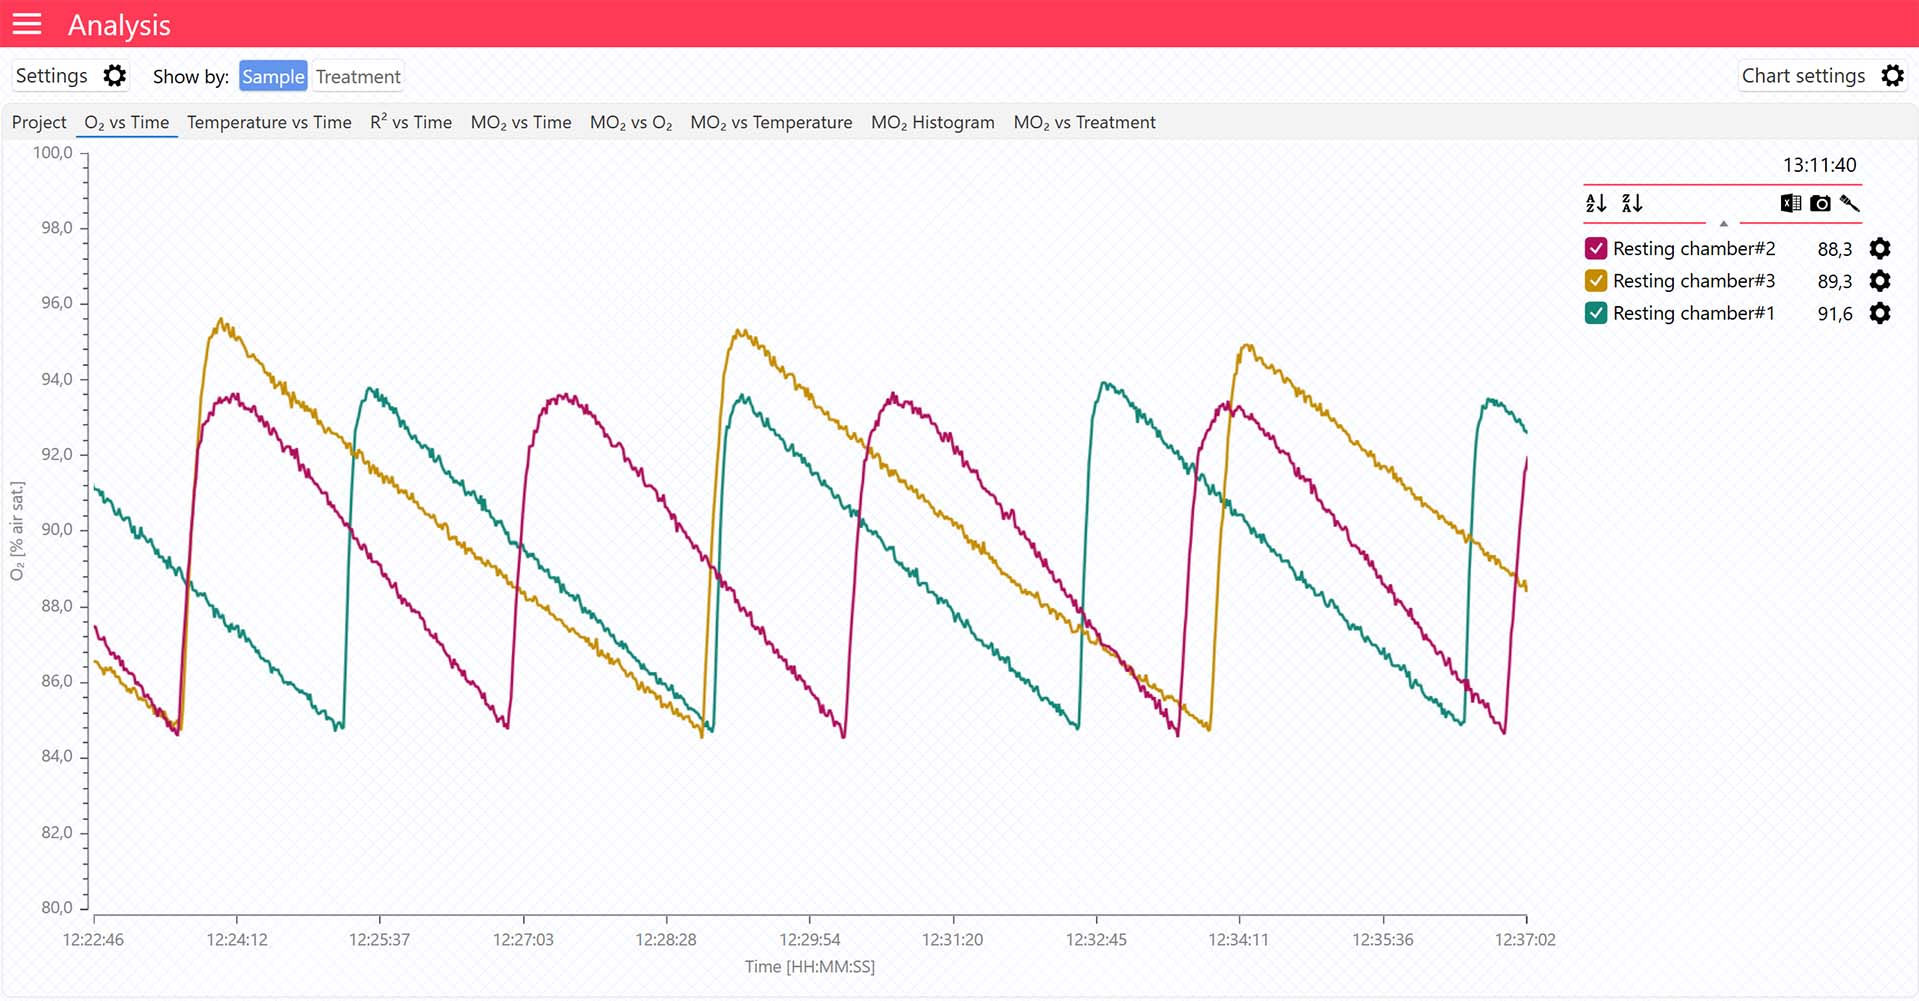
Selecting an individual chamber in the legend panel on the right provides useful visual information on the flush [F], wait [W], and measure [M] phases throughout the experiment (image above). And when selecting multiple channels, each data graph is represented with just a data graph line for clean output.
Loligo® Systems would like to thank Peter and Tilo for hosting us in Hirtshals, and for their kind feedback on using AutoResp™ v3. We are looking forward to a second visit in October.
Want to learn more about AutoResp™ v3?