FAQ
AutoResp™ v3 – Analysis - Chart settings
General
Applies to multiple graphs.
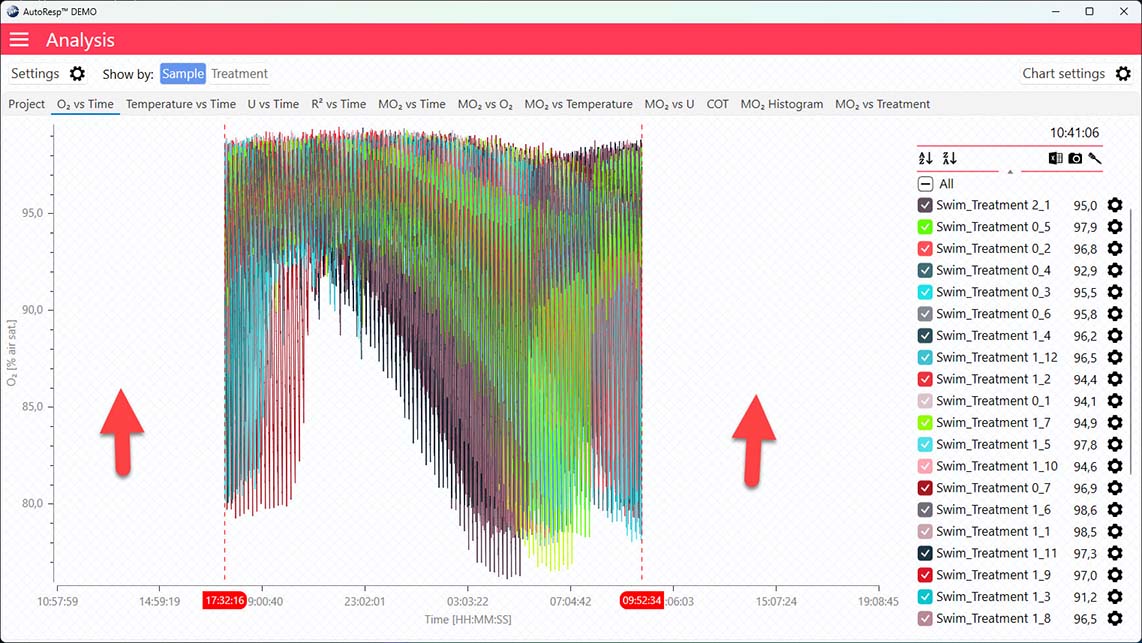
Show excluded data
Show/Hide the data displayed outside the global (or individual) date time handlers (red dotted lines). Is visible when one and multiple channels are selected.
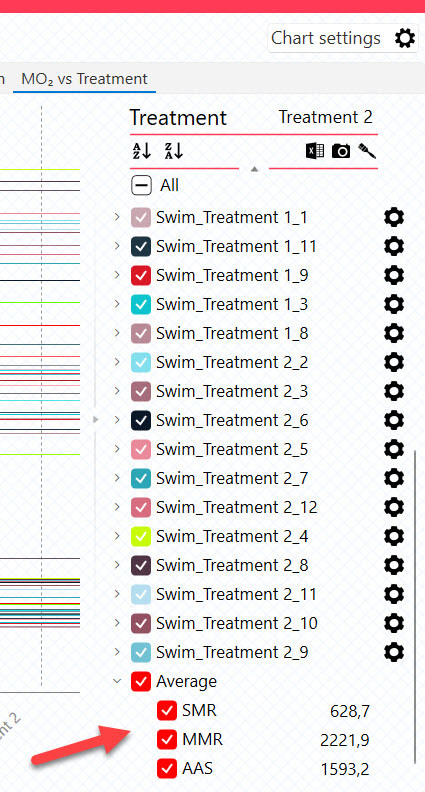
Show average
Show/Hide the average of the following calculated parameters:
SMR + MMR + AAS + Ucrit + Uopt + COTopt
These parameters can also be shown/hidden using the legend menu, when available:
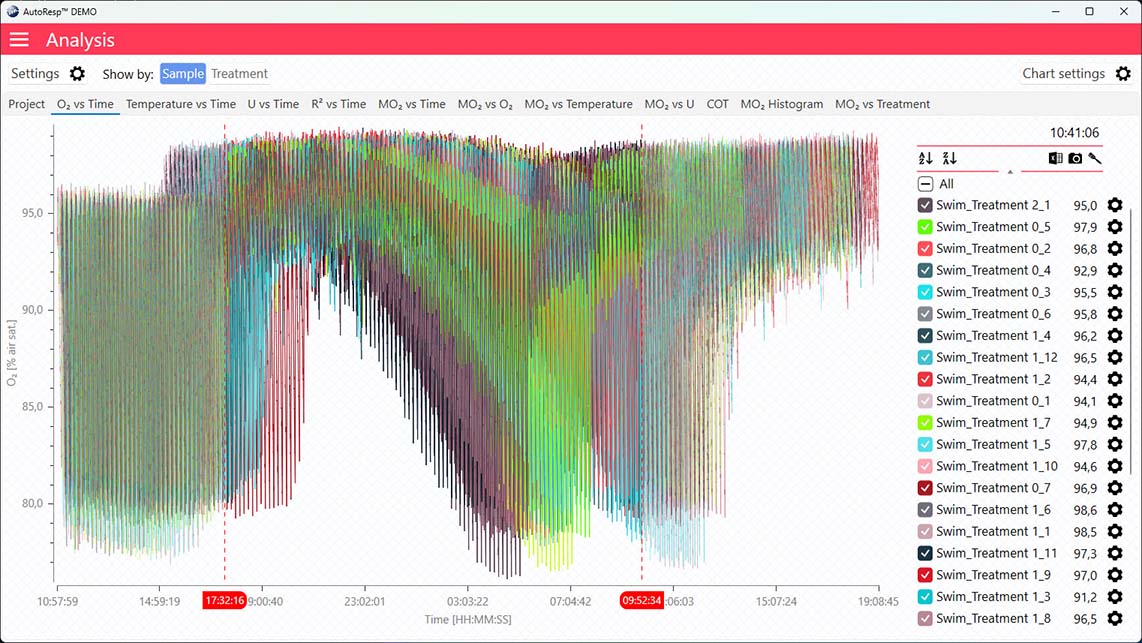
Show global date time handlers
Show/Hide the global date time handlers (red dotted lines). Data outside these lines are shaded (or hidden) and not included in the analysis. Is visible when one and multiple channels are selected.
If the data range has been narrowed even further using the individual data ranges in the settings menu for that channel, the global date time handlers will not show the actual data range:
Show confidence interval
Show/Hide the confidence interval on a graph. Is visible when a single channel is selected.
Show Uopt line
Show/Hide the Uopt line. The Uopt line is available on the COT and MO2 vs U graphs. Is visible when a single channel is selected.
Show COTopt line
Show/Hide the COTopt line. The COTopt line can also be shown or hidden using the legend menu. Is visible when one and multiple channels are selected.
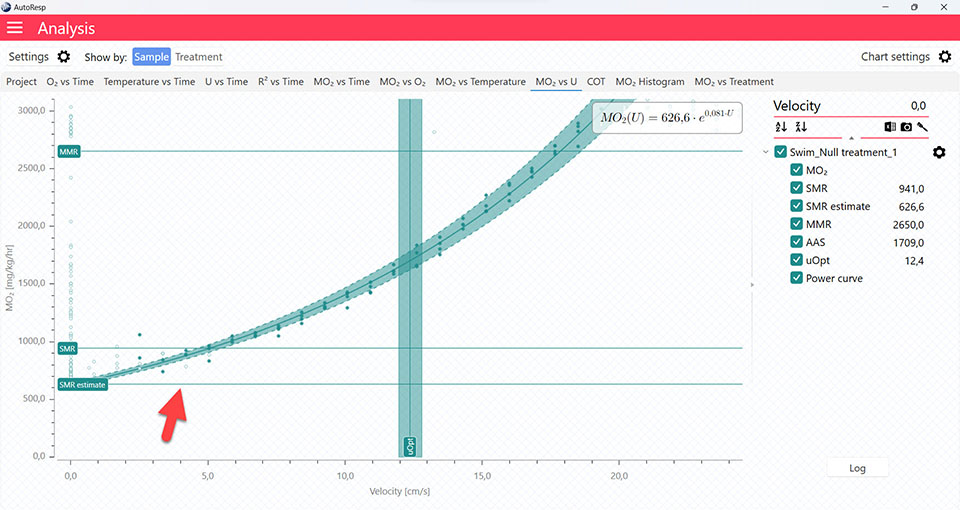
Show SMR estimate from speed curve
Show/Hide the SMR estimate based on the speed curve. Is visible when one and multiple channels are selected.
Show equations
Show/Hide the MO2 equation for the specific data graph. Is visible when a single channel is selected.
O2 vs Time
Applies to the O2 vs Time graph.
The following parameters: FWM (Flush, Wait, Measure phase), regression line, and single mode are only visible when a single channel is selected. If set to YES, the data graph for a single channel will show as:
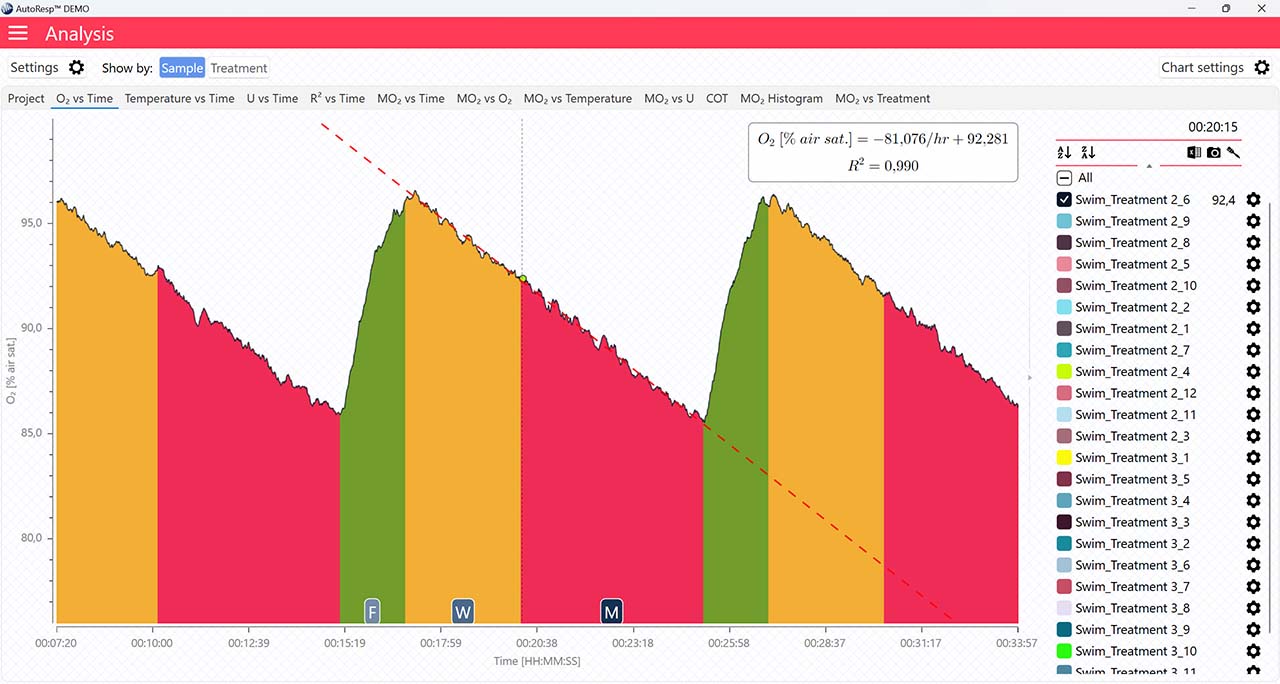
Show FWM
If set to NO, the flush, wait, and measure indicators will not be visible.
Show regression line
If set to NO, the regression line and its equation will not be visible.

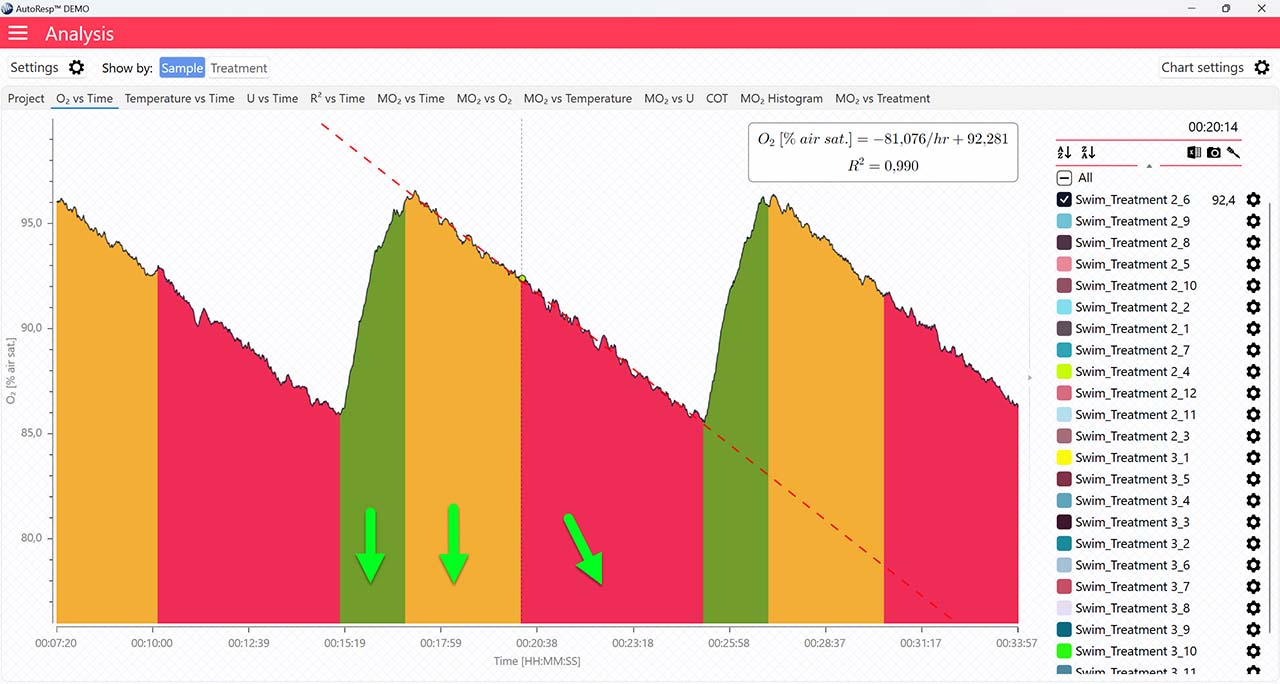
Single mode
If set to NO, the FWM phase colors will not be visible.
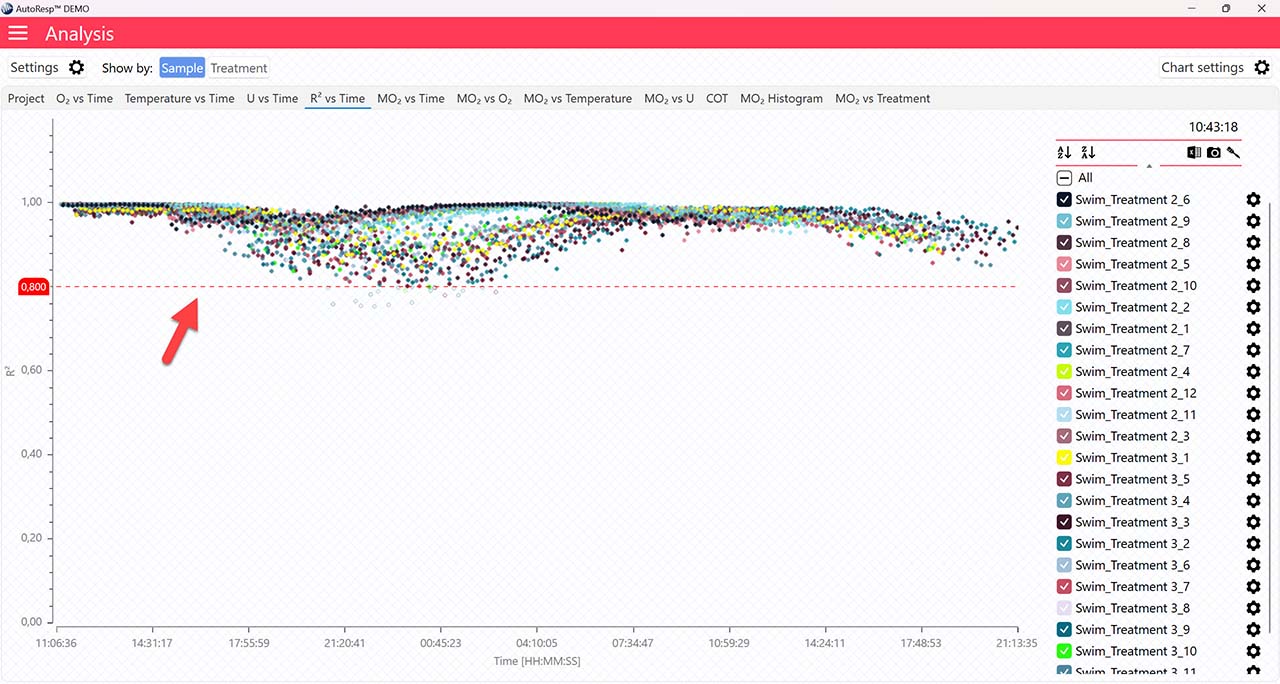
R2 vs Time
Applies to the R2 vs Time graph.
Show R2 minimum line
Show/Hide the minimum R2 value. The minimum R2 value must be specified in the Settings menu first. Is visible when one and multiple channels are selected.
MO2 vs O2
Applies to the R2 vs Time graph.
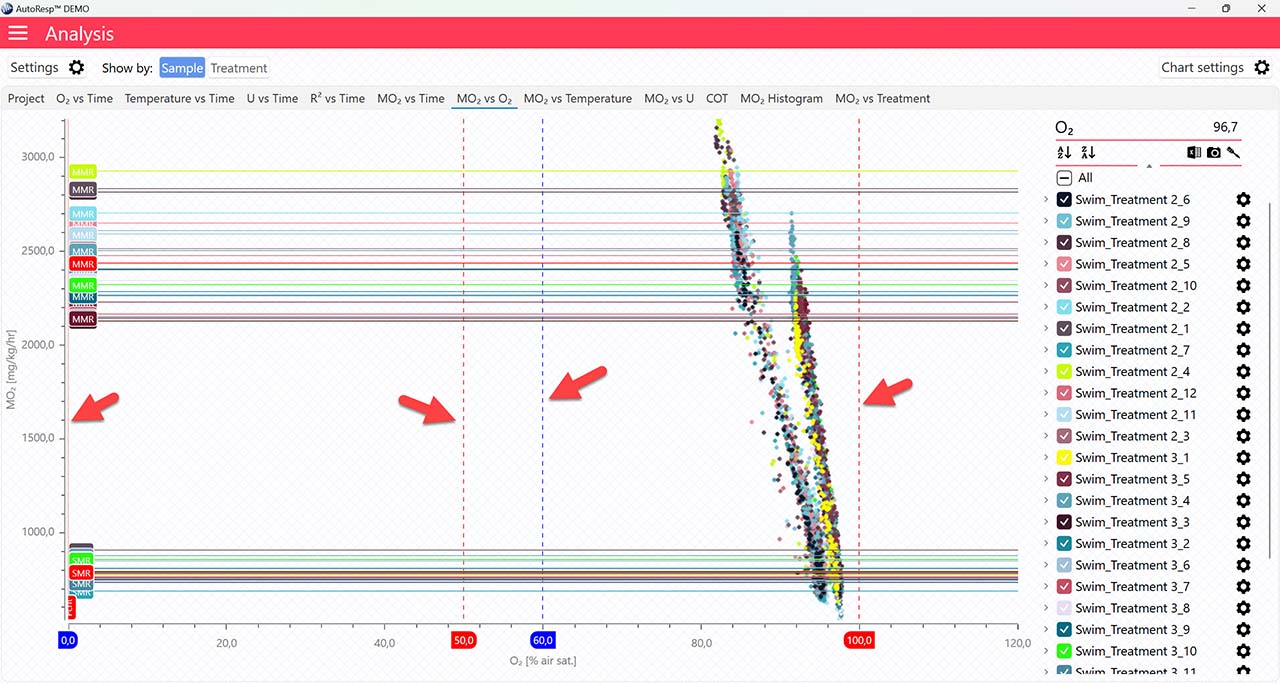
Show Min Max O2 handlers
Show/Hide the minimum and maximum O2 handlers for SMR and MMR (red dotted lines) and Pcrit (blue dotted lines). The handle values can be set in the Settings menu or by clicking and dragging on the dotted lines directly on the graph. Are visible when one and multiple channels are selected.
Show Pcrit value line
Show/Hide the calculated Pcrit value line based on the chosen method in the Settings menu. Is visible when one and multiple channels are selected. The Pcrit value can also be shown or hidden in the legend menu for each channel.
Show Pcrit line
Show/Hide the calculated Pcrit line based on the chosen method in the Settings menu. Is visible when one and multiple channels are selected. The Pcrit value can also be shown or hidden in the legend menu for each channel.
MO2 vs X
Applies to all MO2 vs… graphs.
Show SMR line
Show/Hide the SMR lines. Is visible when one and multiple channels are selected.
Show MMR line
Show/Hide the MMR lines. Is visible when one and multiple channels are selected.
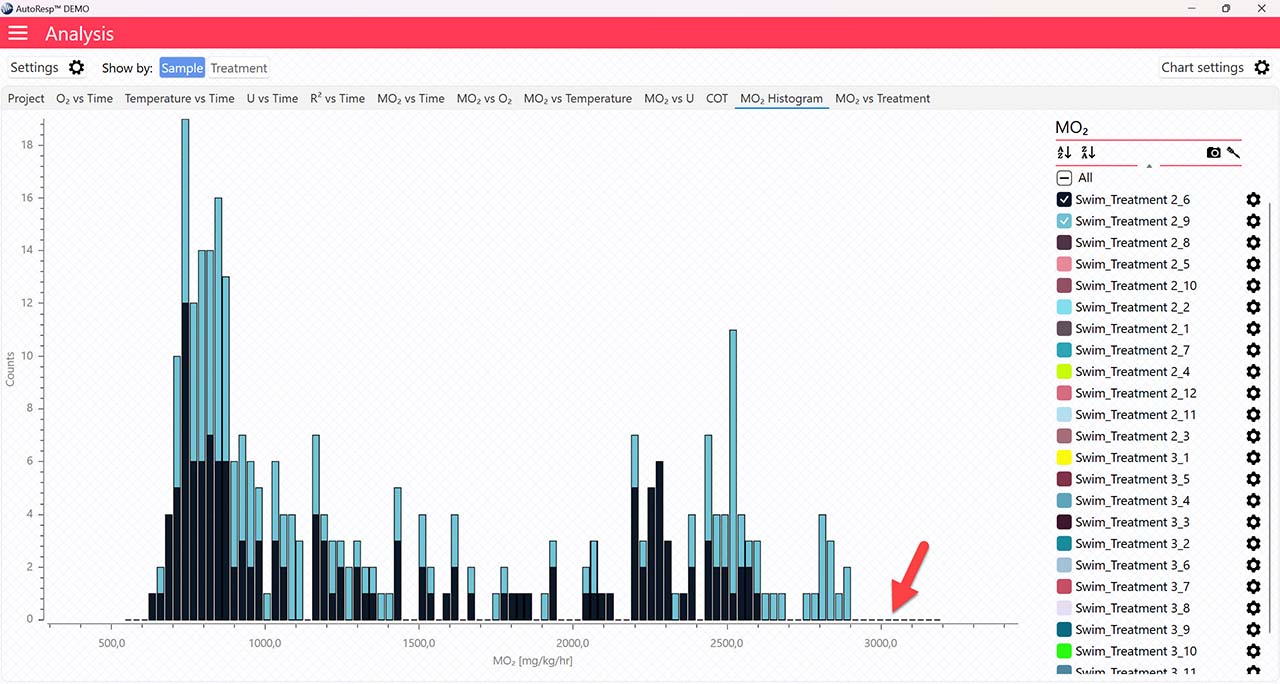
MO2 Histogram
Applies to the MO2 Histogram.
Draw zero data points
Show/Hide the histogram data points that have had no counts. Is visible when one and multiple channels are selected.
AutoResp™ v3 – How to find the Standard Metabolic Rate (SMR)
Use AutoResp™ v3 to calculate Standard Metabolic Rate (SMR) from your logged data files.
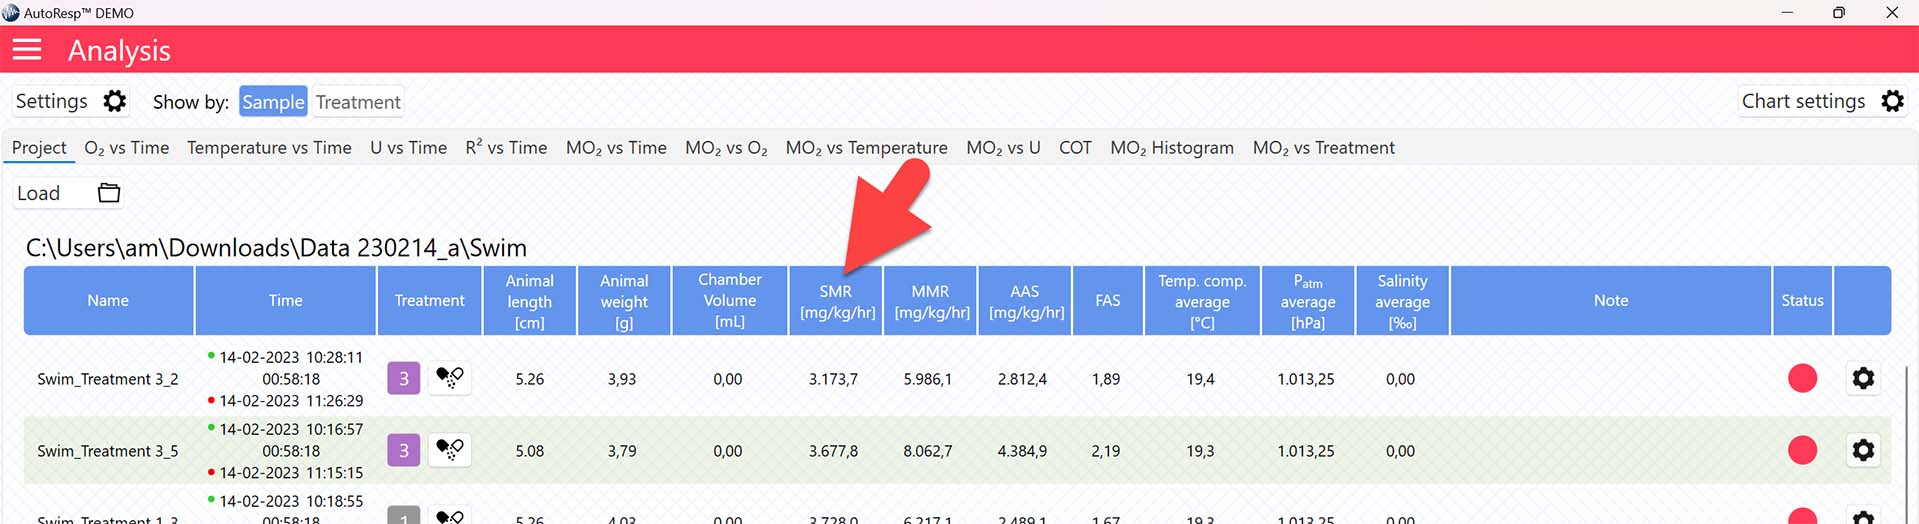
Main menu > Analysis > Project tab > Load a swim tunnel or resting chamber file (.ar3)
The SMR value is now shown in the SMR column in the Project tab for each swim tunnel or resting chamber, but note that the method for calculating SMR can be changed (see Selecting SMR-method):
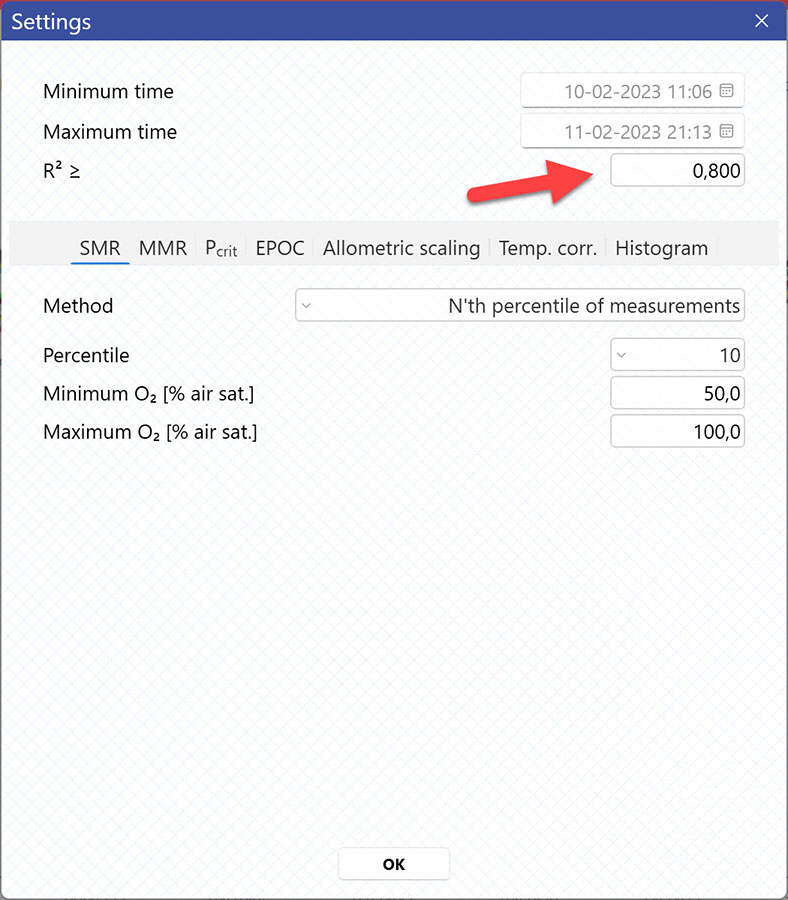
Selecting SMR-method
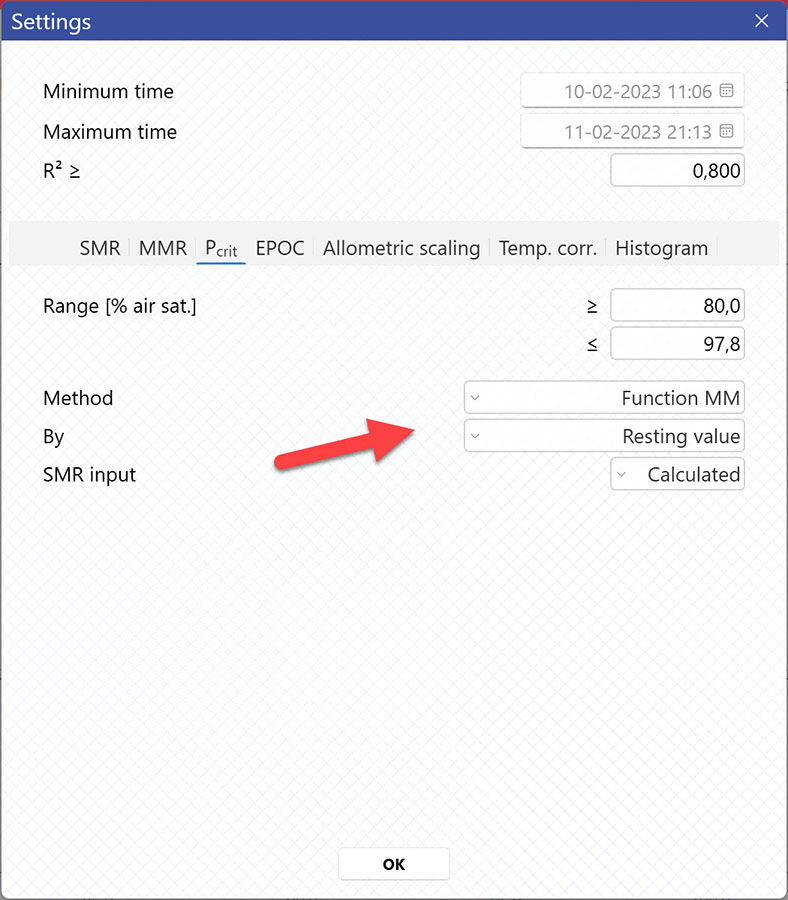
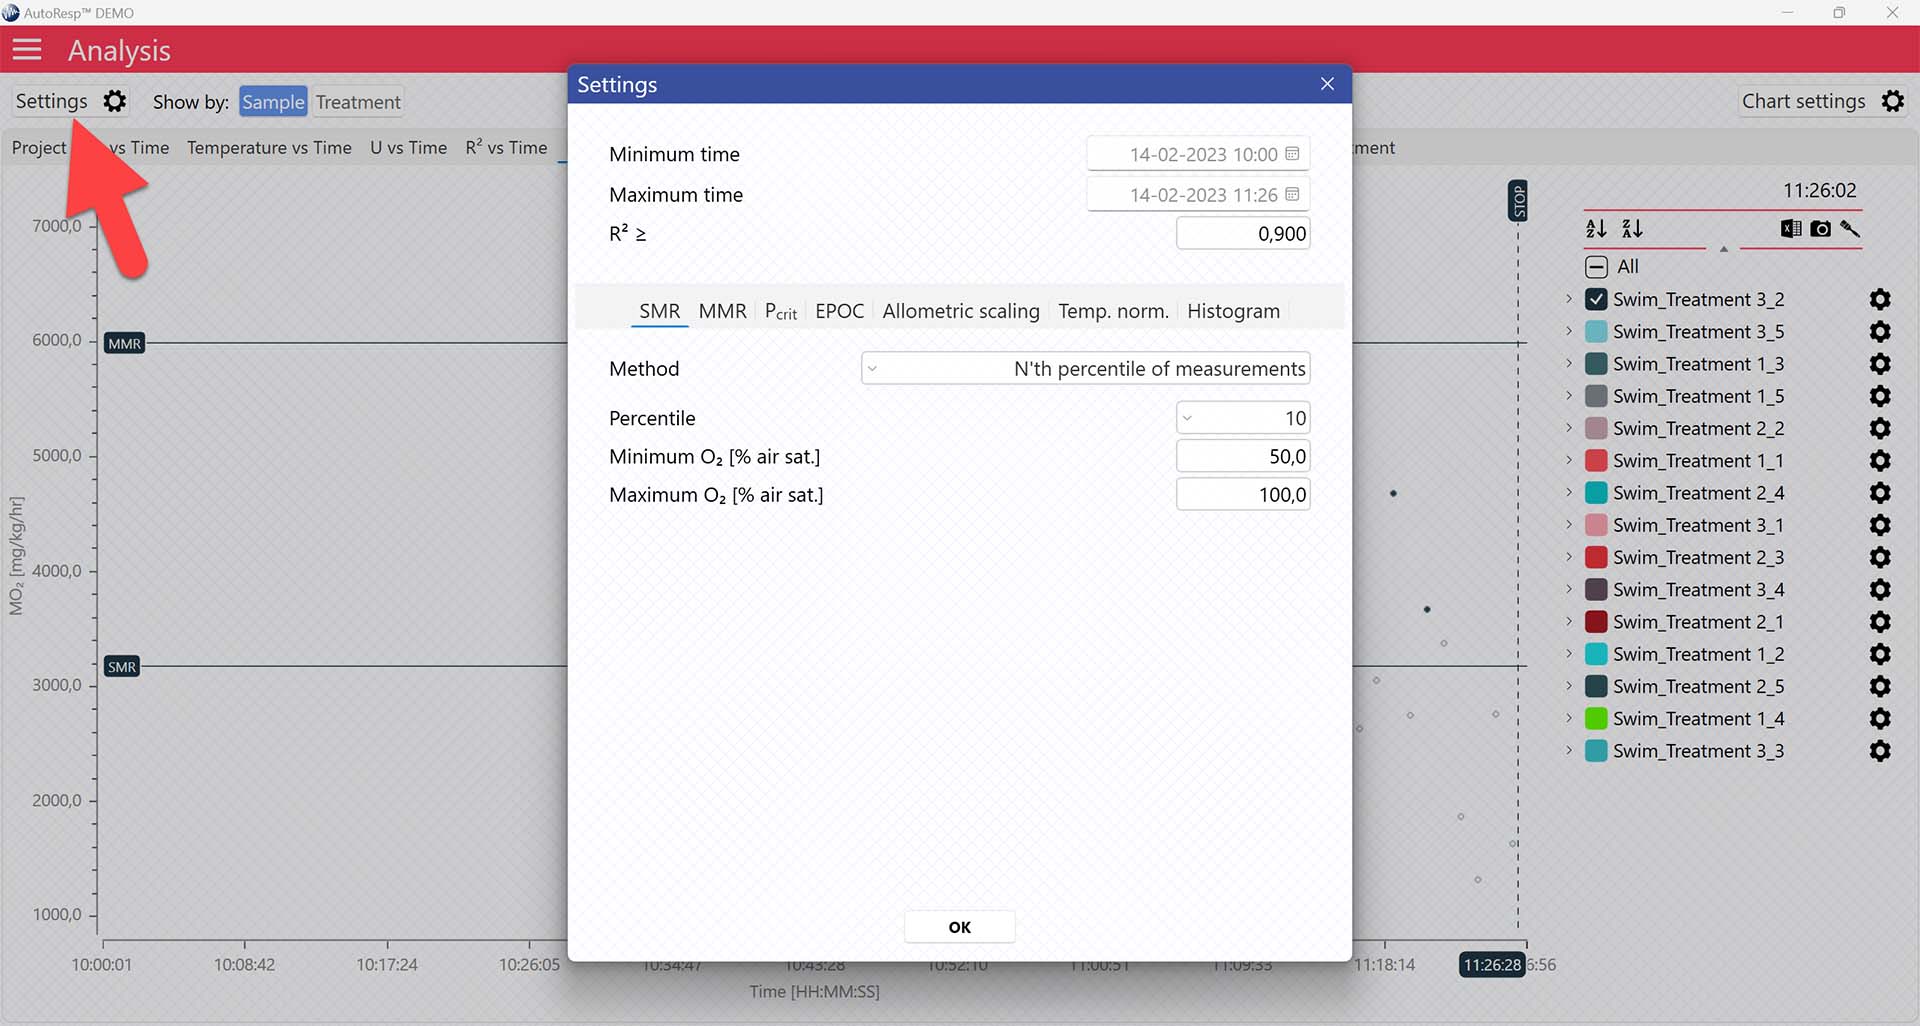
AutoResp™ v3 offers several ways of calculating SMR. The calculation method can be changed in the Settings menu > SMR tab > Method:
Each method is described in details in the AutoResp™ 3 - Algorithms summary.
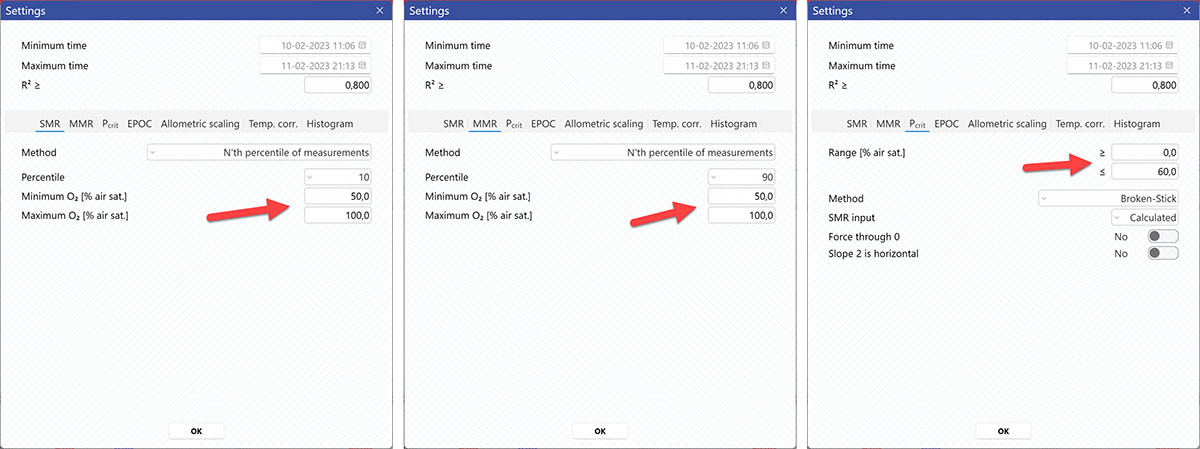
Setting data range for SMR calculations
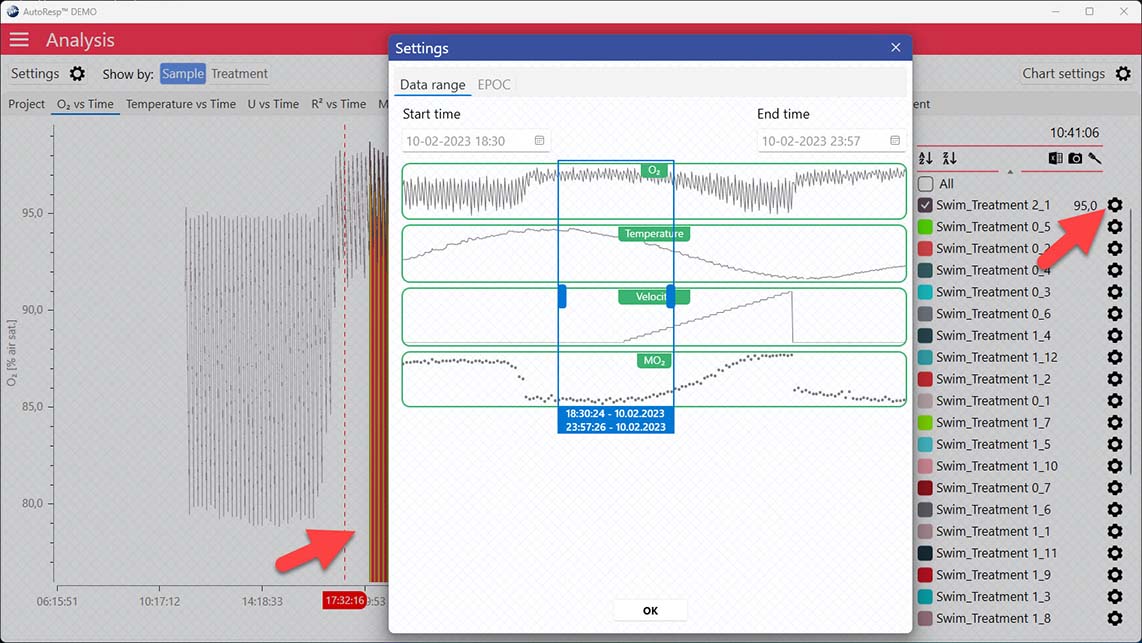
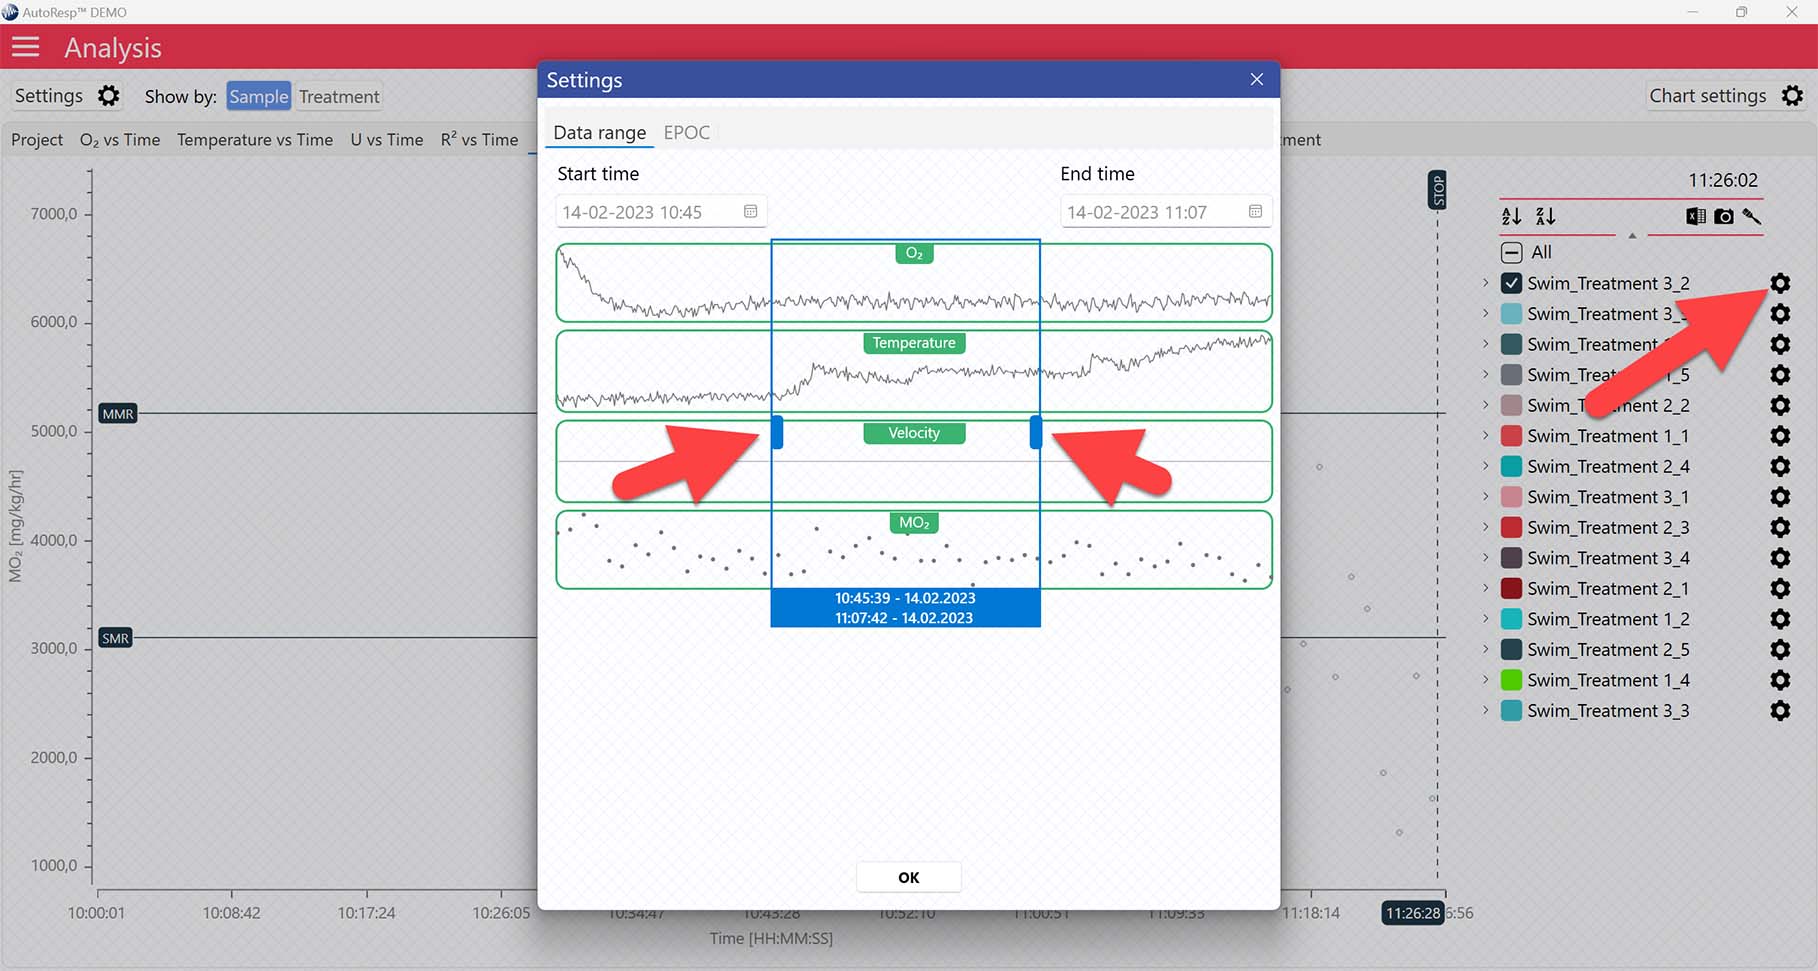
Setting a Minimum O2 and Maximum O2 value will filter away MO2-values outside the selected range, and those MO2-values will not be used in the calculations. You can also exclude MO2-values for each individual channel using the settings icon in the legend panel. Drag the blue handlers to set the range or input the values directly in the Start time and End time fields above:
A global data range (meaning it applies to all your analyzed data files) can be set in the Settings menu. Set the desired time interval or exclude data based on the R2-value:

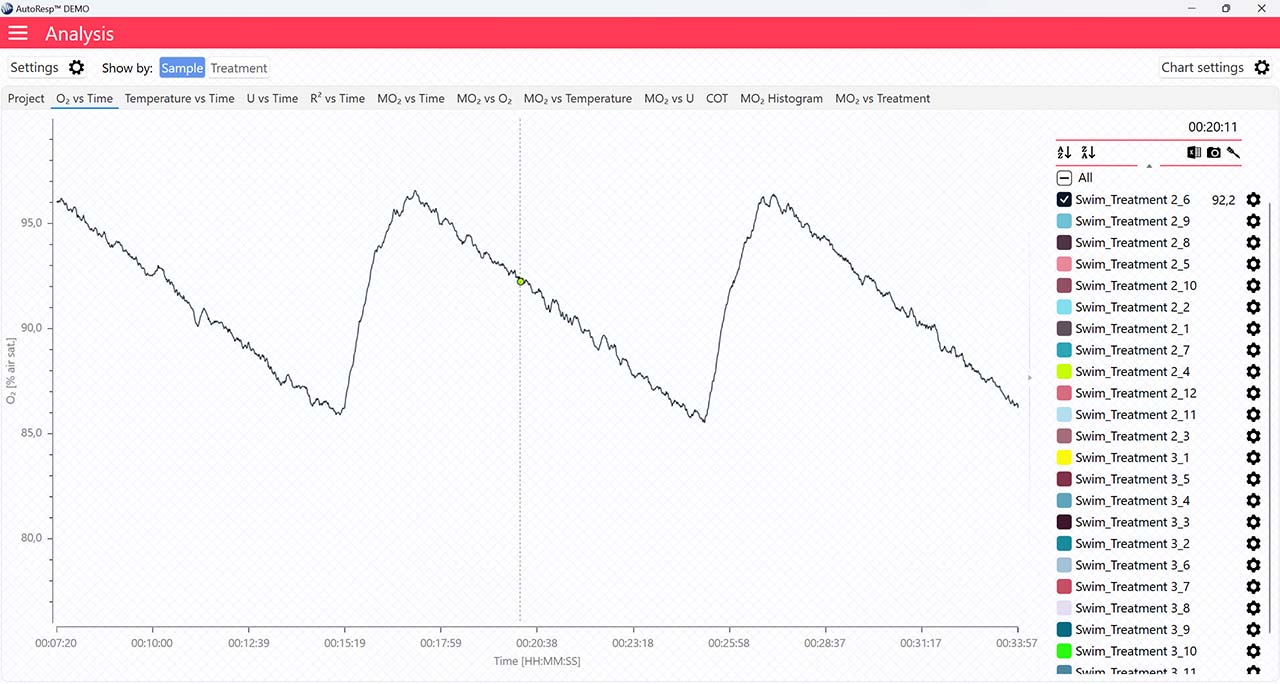
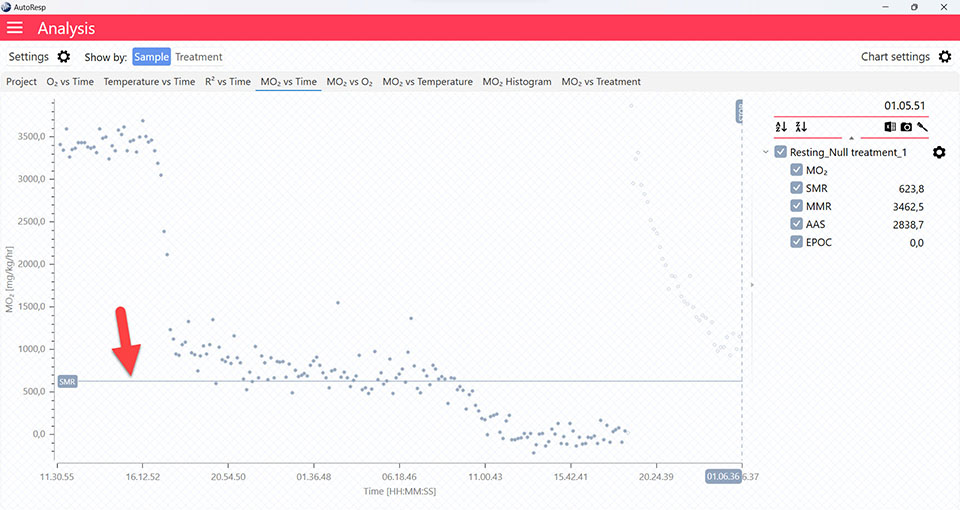
SMR graphs
The MO2 vs Time and MO2 vs O2 tabs will give you graphs with a horizontal line representing the SMR value calculated by the AutoResp™ 3. The exact SMR value is shown in the legend panel, when you open the channel using the small arrow next to the colored checkbox. Note that multiple SMR lines can be shown by selecting more channels in the legend panel:
AutoResp™ v3 – How to find the Maximum Metabolic Rate (MMR)
Use AutoResp™ v3 to calculate Maximum Metabolic Rate (MMR) from your logged data files.
Main menu > Analysis > Project tab > Load a swim tunnel or resting chamber file (.ar3)
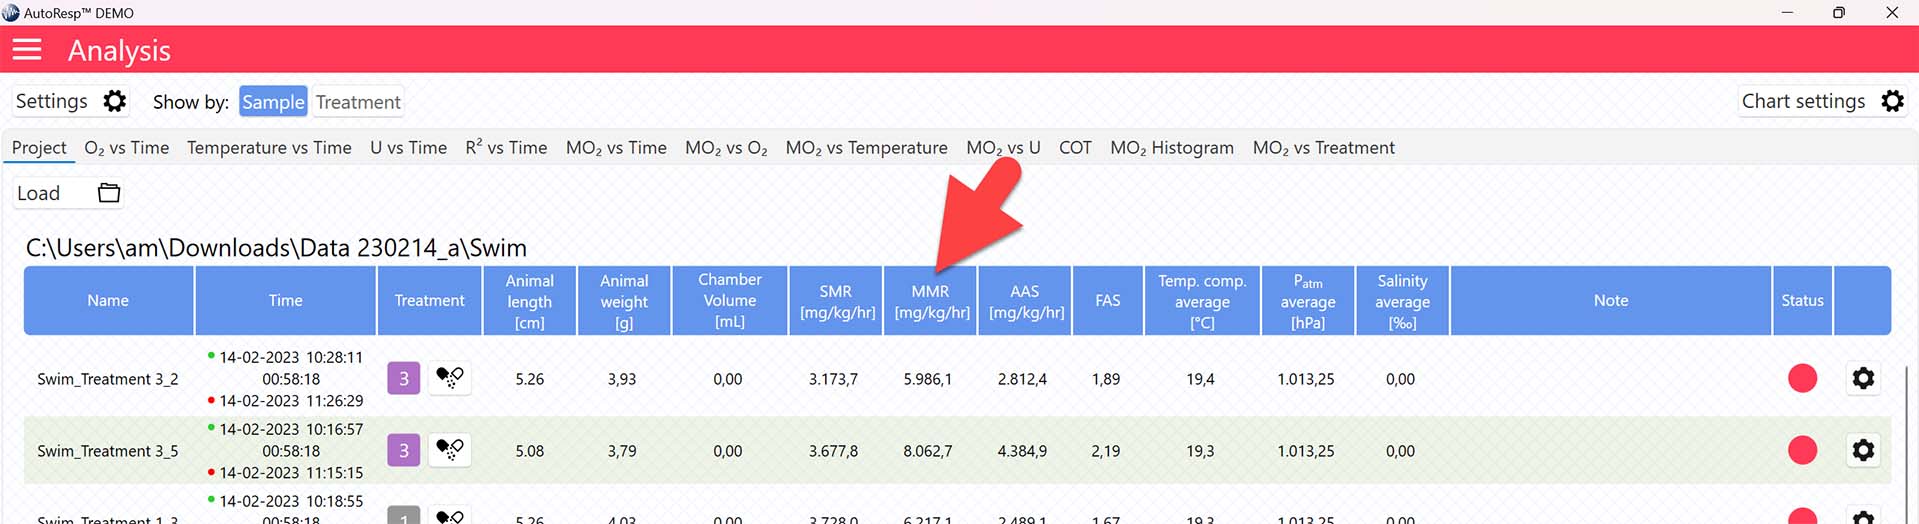
The MMR value is now shown in the MMR column in the Project tab for each swim tunnel or resting chamber, but note that the method for calculating MMR can be changed (see Selecting MMR-method):
Selecting MMR-method
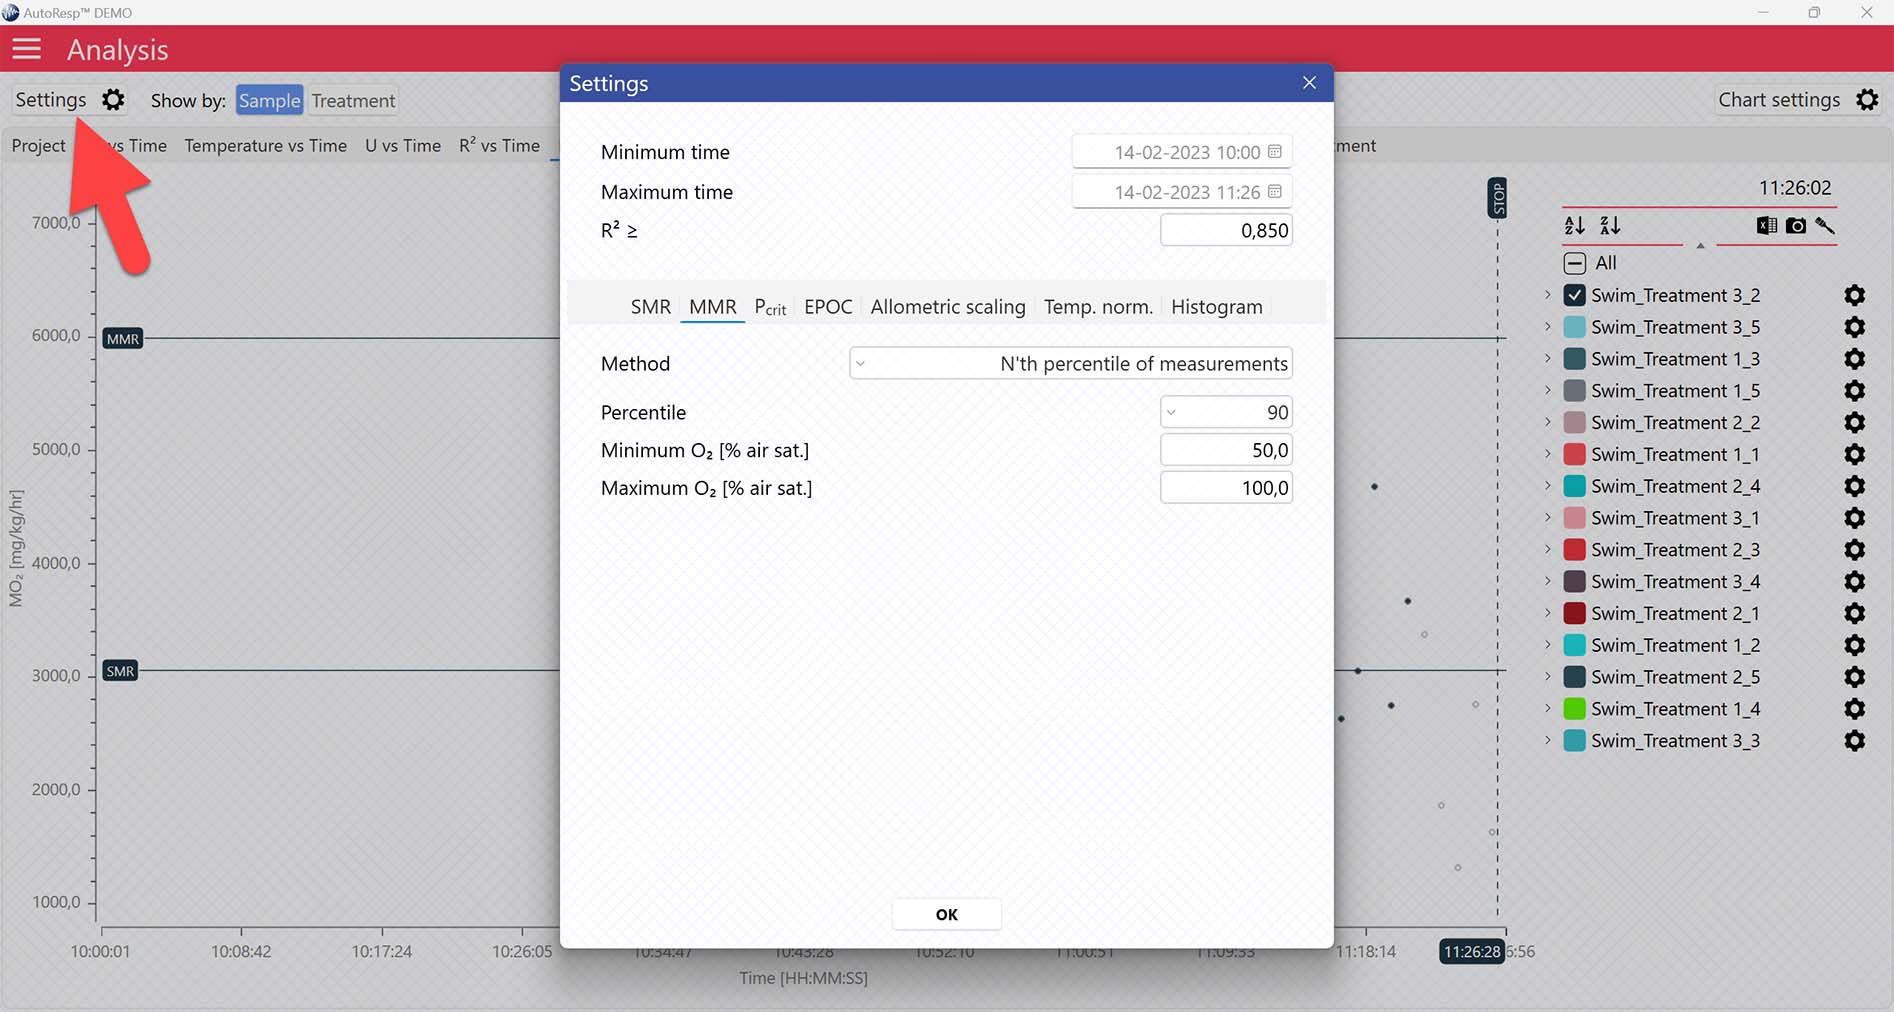
AutoResp™ v3 offers several ways of calculating MMR. The calculation method can be changed in the Settings menu > MMR tab > Method:
Each method is described in details in the AutoResp™ 3 - Algorithms summary.
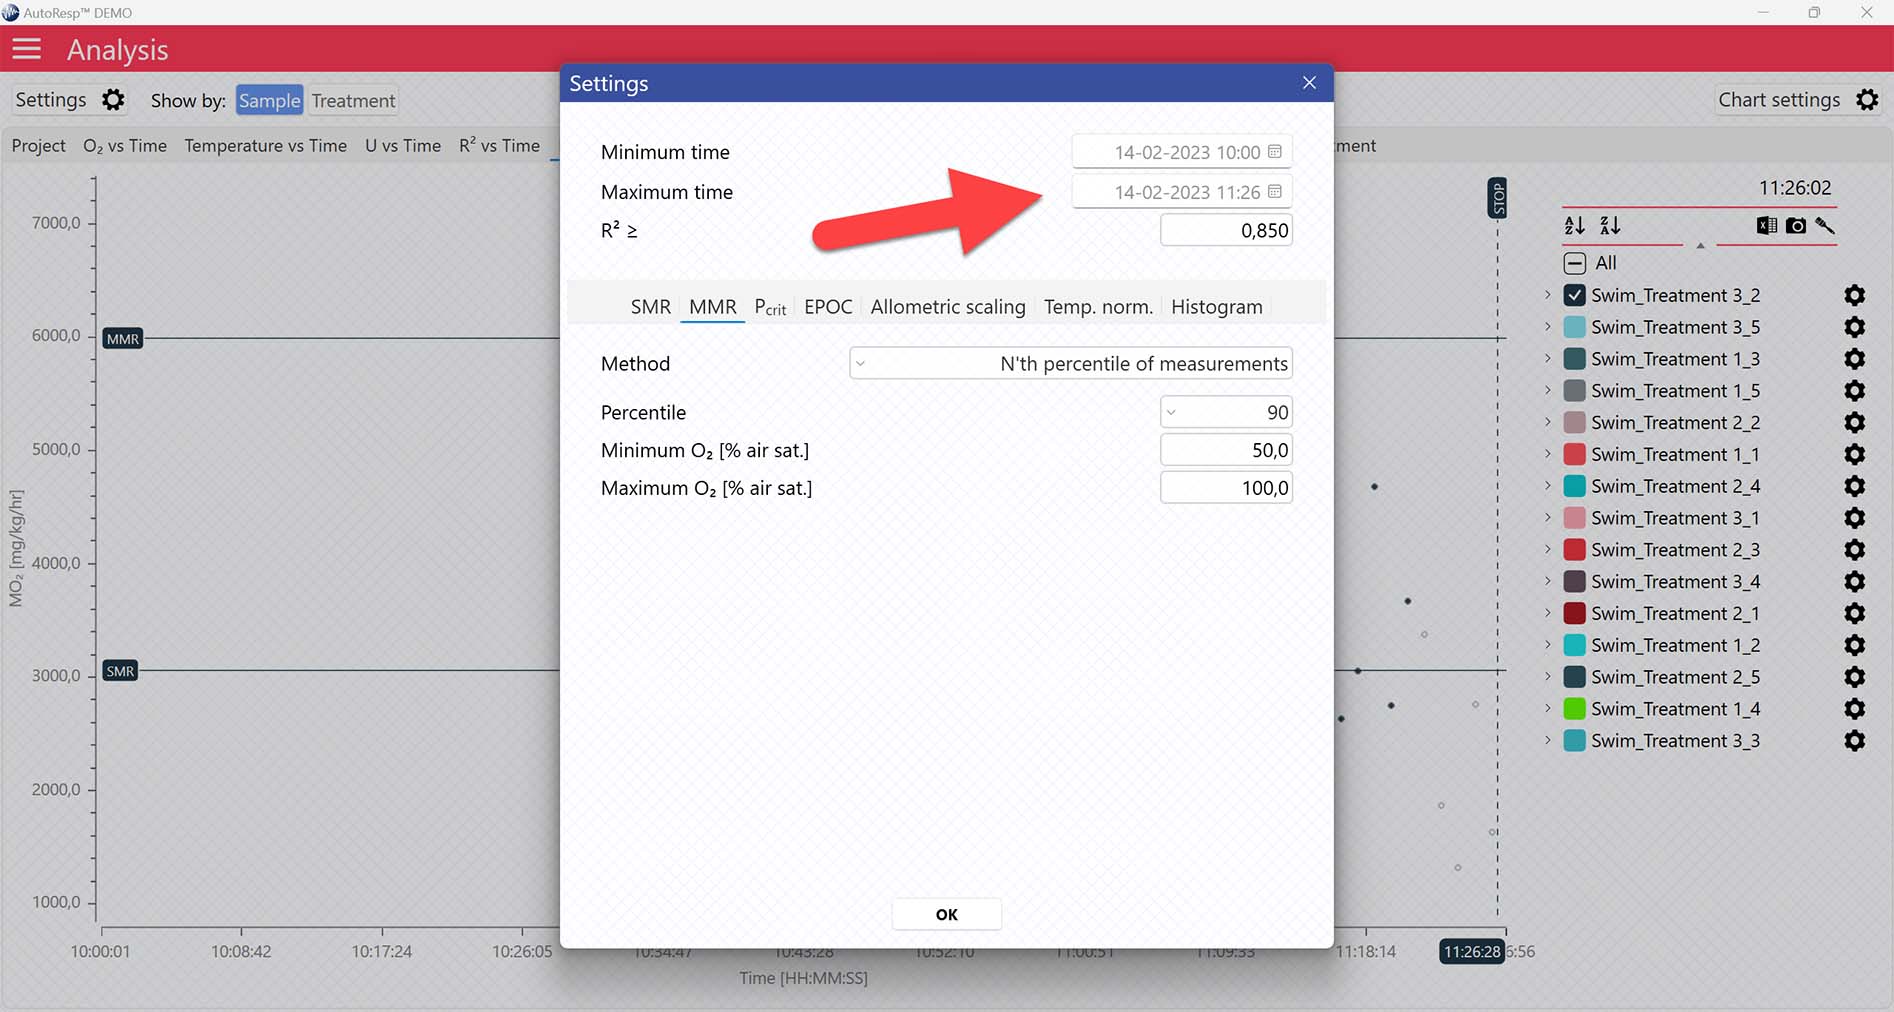
Setting data range for MMR calculations
Setting a Minimum O2 and Maximum O2 value will filter away MO2-values outside the selected range, and those MO2-values will not be used in the calculations. You can also exclude MO2-values for each individual channel using the settings icon in the legend panel. Drag the blue handlers to set the range or input the values directly in the Start time and End time fields above:
A global data range (meaning it applies to all your analyzed data files) can be set in the Settings menu. Set the desired time interval or exclude data based on the R2-value:
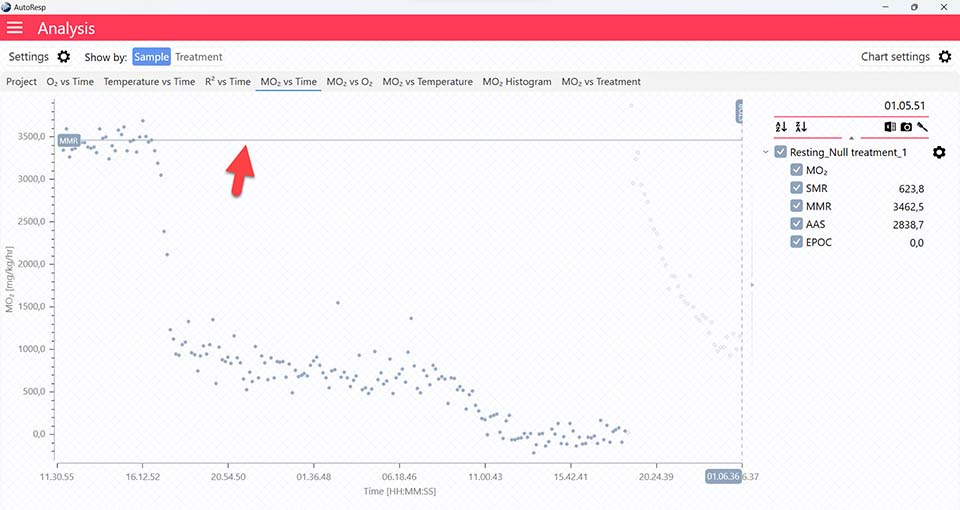
MMR graphs
The MO2 vs Time and MO2 vs O2 tabs will give you graphs with a horizontal line representing the MMR value calculated by the AutoResp™ 3. The exact MMR value is shown in the legend panel, when you open the channel using the small arrow next to the colored checkbox. Note that multiple MMR lines can be shown by selecting more channels in the legend panel:
AutoResp™ v3 – How to find the critical lower oxygen level (Pcrit)
Use AutoResp™ v3 to calculate the partial pressure of oxygen (Pcrit) below which the animal can no longer maintain a stable metabolic rate (MO2) from your logged data files:
Main menu > Analysis > Project tab > Load a swim tunnel or resting chamber .ar3 file
Pcrit graphs
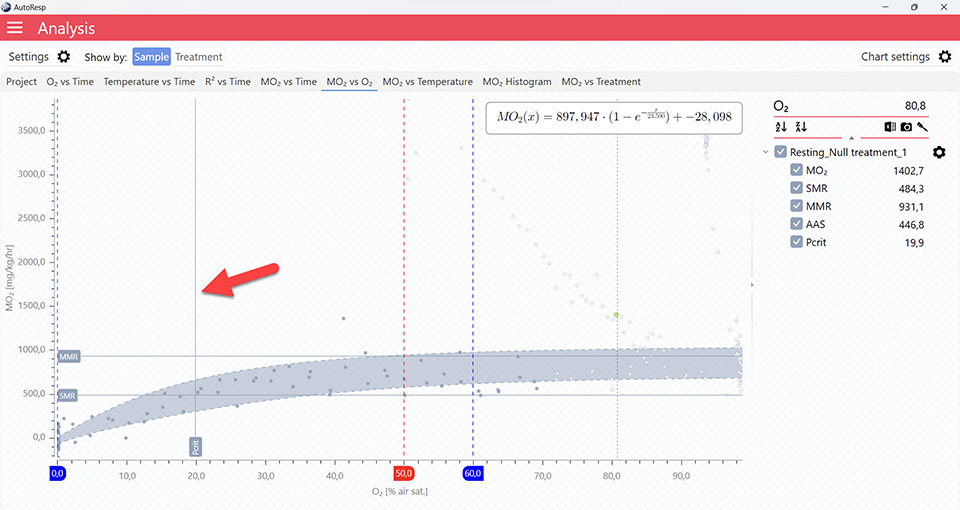
The MO2 vs O2 tab will give you a graph of Pcrit. The exact Pcrit-value is shown in the legend panel, when you open the channel using the small arrow next to the colored checkbox.
The Pcrit value line shows where Pcrit is located on the X-axis. Note that multiple Pcrit value lines can be shown by selecting more channels in the legend panel:
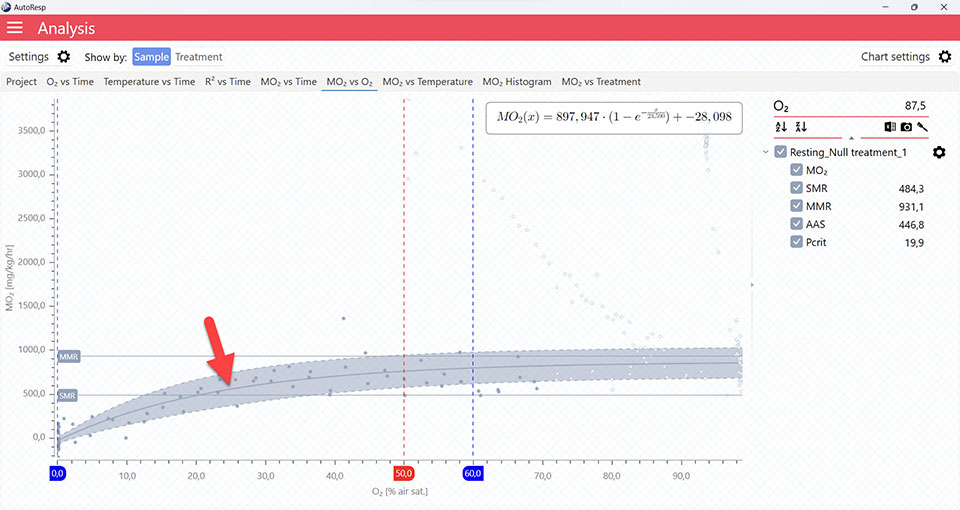
The Pcrit line shows the fitted function for the Pcrit-calculation. The colored band above and below the function is the confidence interval. Multiple Pcrit lines can be viewed by selecting multiple channels in the legend panel, but if you want to see the confidence interval for a specific Pcrit line, only a single channel must be selected:
The Pcrit value line, Pcrit line, and confidence interval can be shown or hidden using the Chart settings menu.
Selecting Pcrit-method
AutoResp™ v3 offers several ways of calculating Pcrit. The calculation method can be changed in the Settings menu > Pcrit tab > Method:
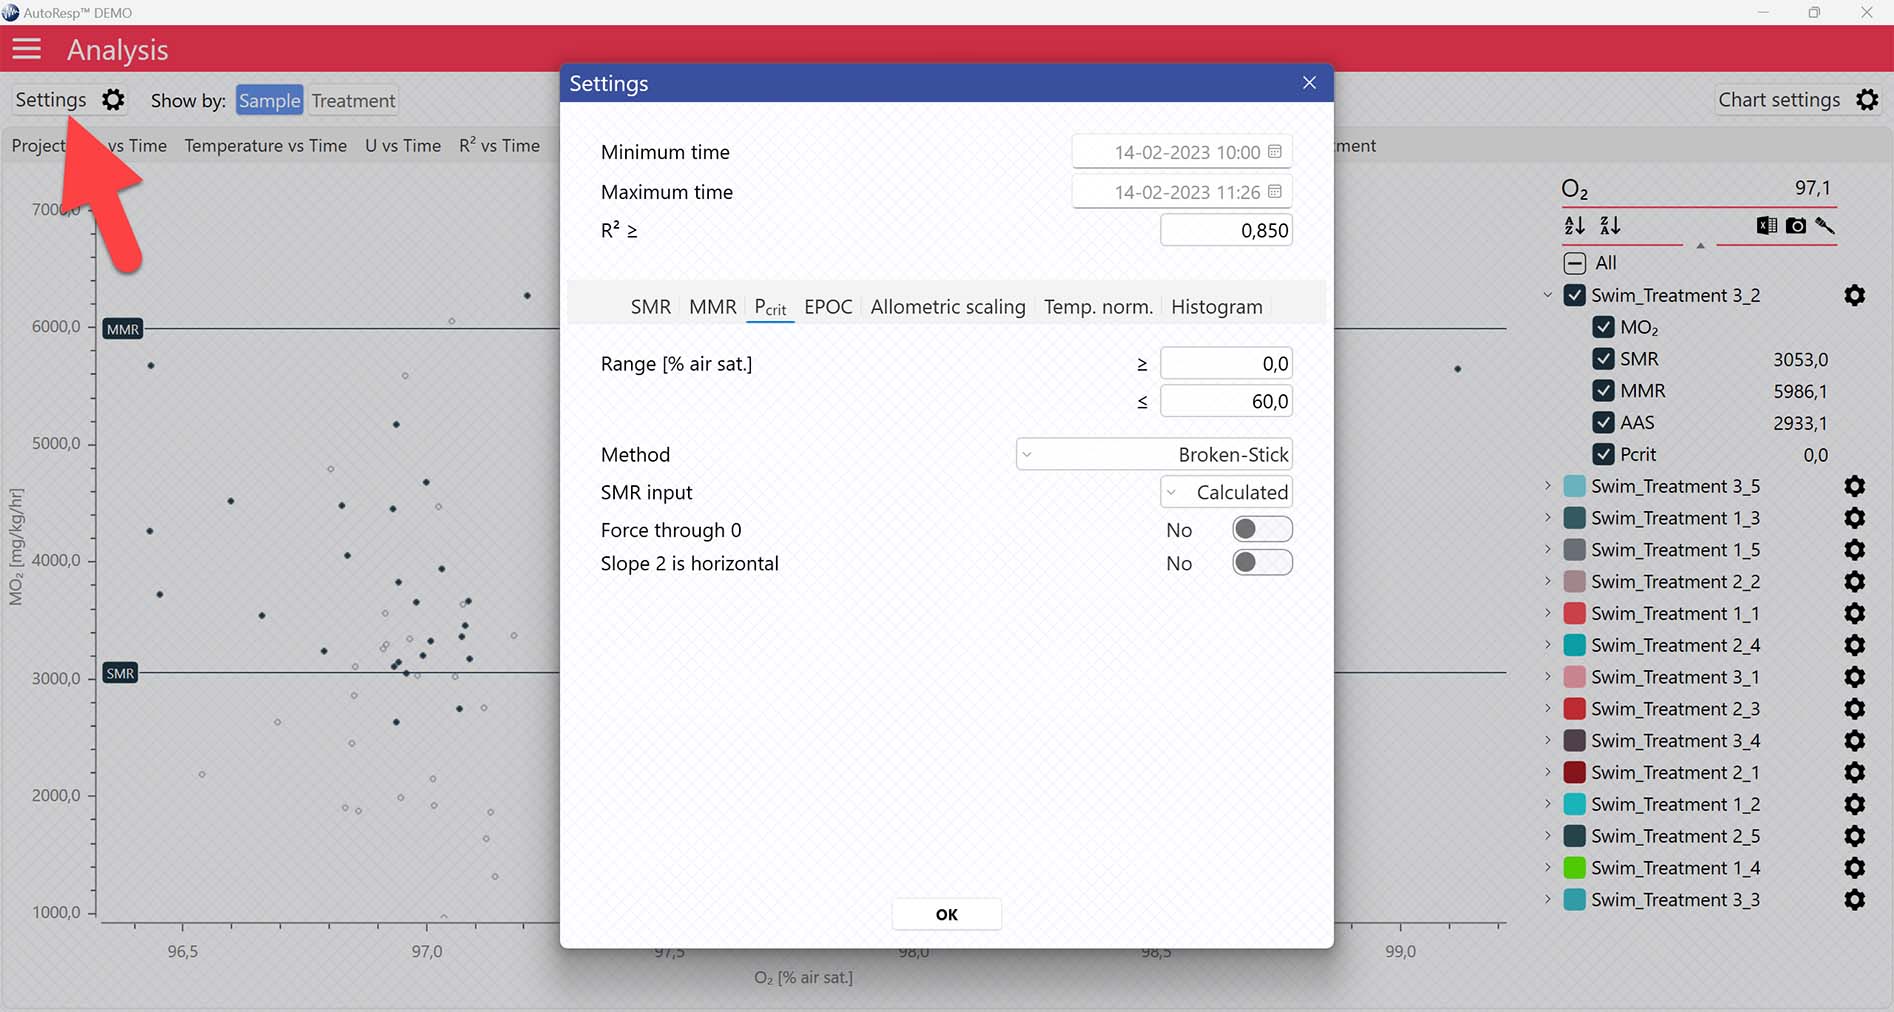
Each method is described in details in the AutoResp™ 3 - Algorithms summary.
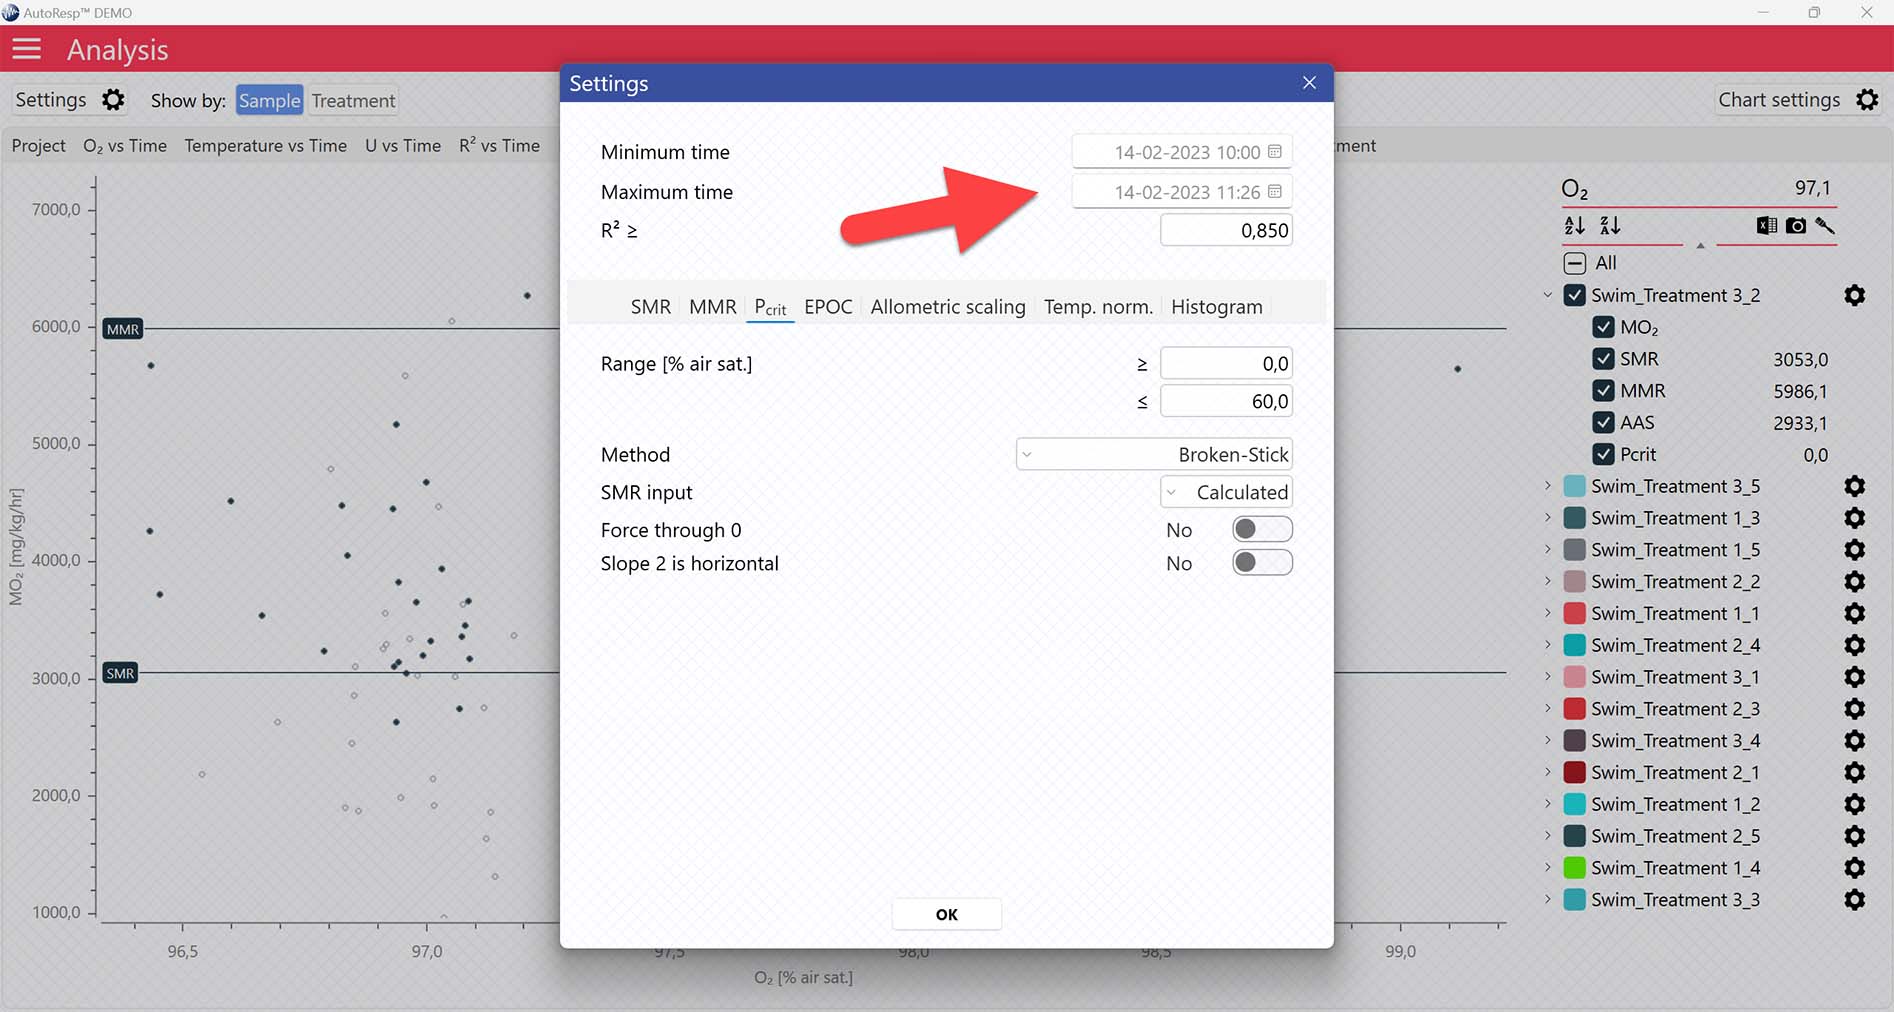
Setting data range for Pcrit calculations
Setting Range [% air sat.] values in the Settings menu > Pcrit tab will filter away MO2-values outside the selected range, and those MO2-values will not be used in the calculations. You can also exclude MO2-values for each individual channel using the settings icon in the legend panel. Drag the blue handlers to set the range or input the values directly in the Start time and End time fields above:
A global data range (meaning it applies to all your analyzed data files) can be set in the Settings menu. Set the desired time interval or exclude data based on the R2-value:
AutoResp™ v3 – How to find the Cost Of Transport (COT) and COTopt
Use AutoResp™ v3 to calculate Cost Of Transport (COT) values from your logged data files:
Main menu > Analysis > Project tab > Load a swim tunnel .ar3 file
COT graphs
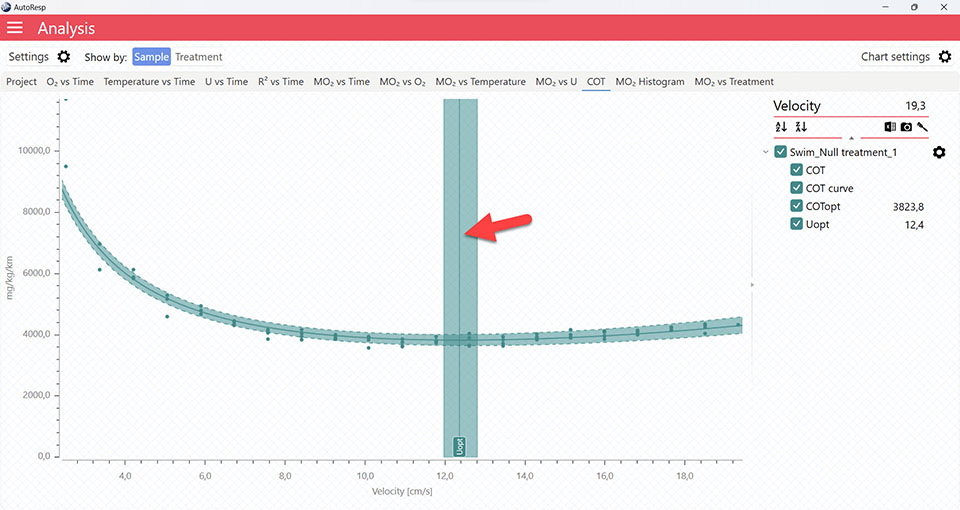
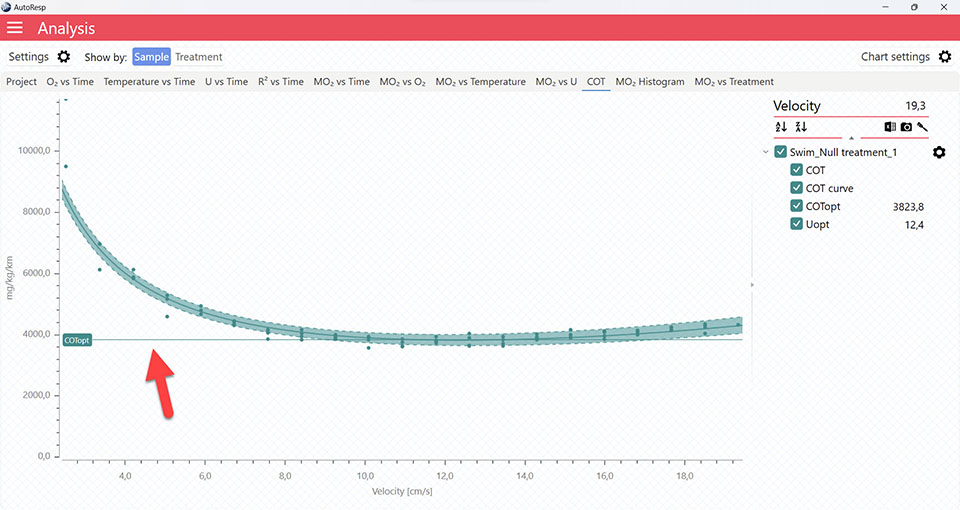
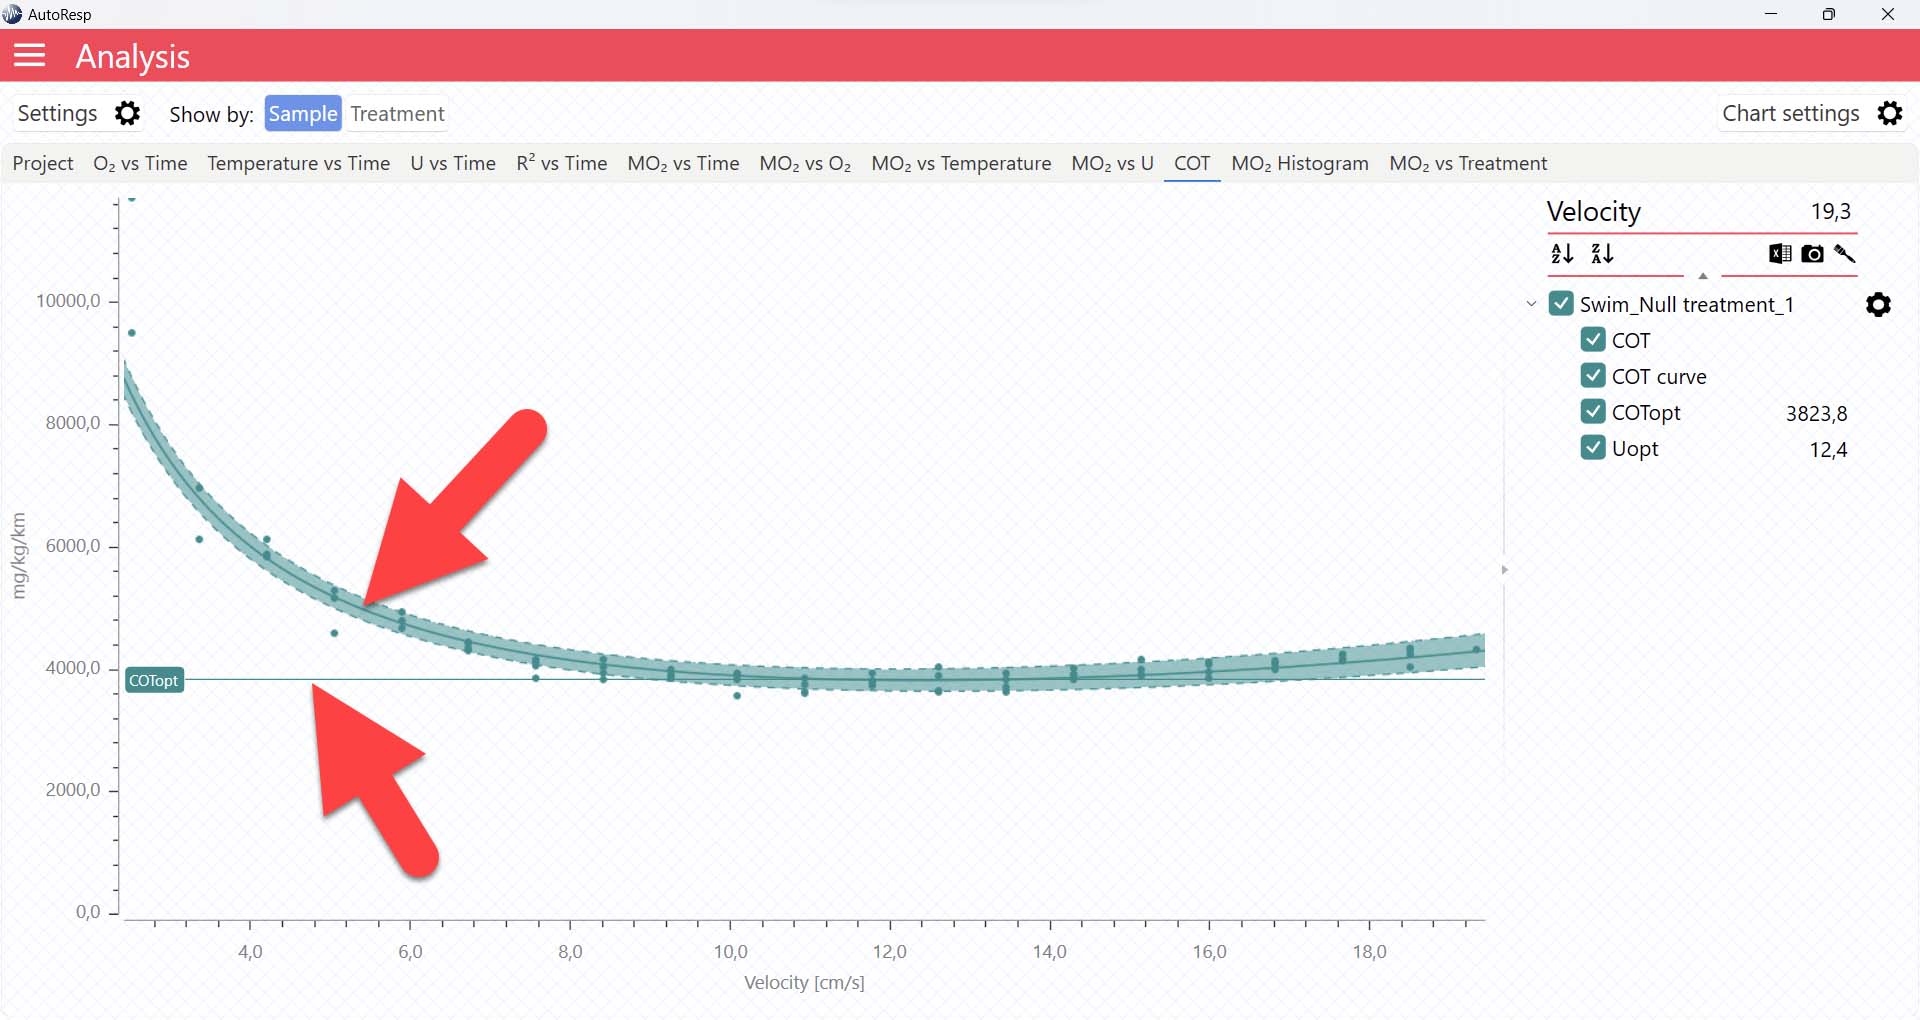
The COT tab will give you a graph of COT. The COT values are also shown in the legend panel, when you open the channel using the small arrow next to the colored checkbox. Note that multiple COTs and COTopt lines can be viewed by selecting multiple channels in the legend panel, but if you want to see the confidence interval for a specific COT or COTopt line, only a single channel must be selected:
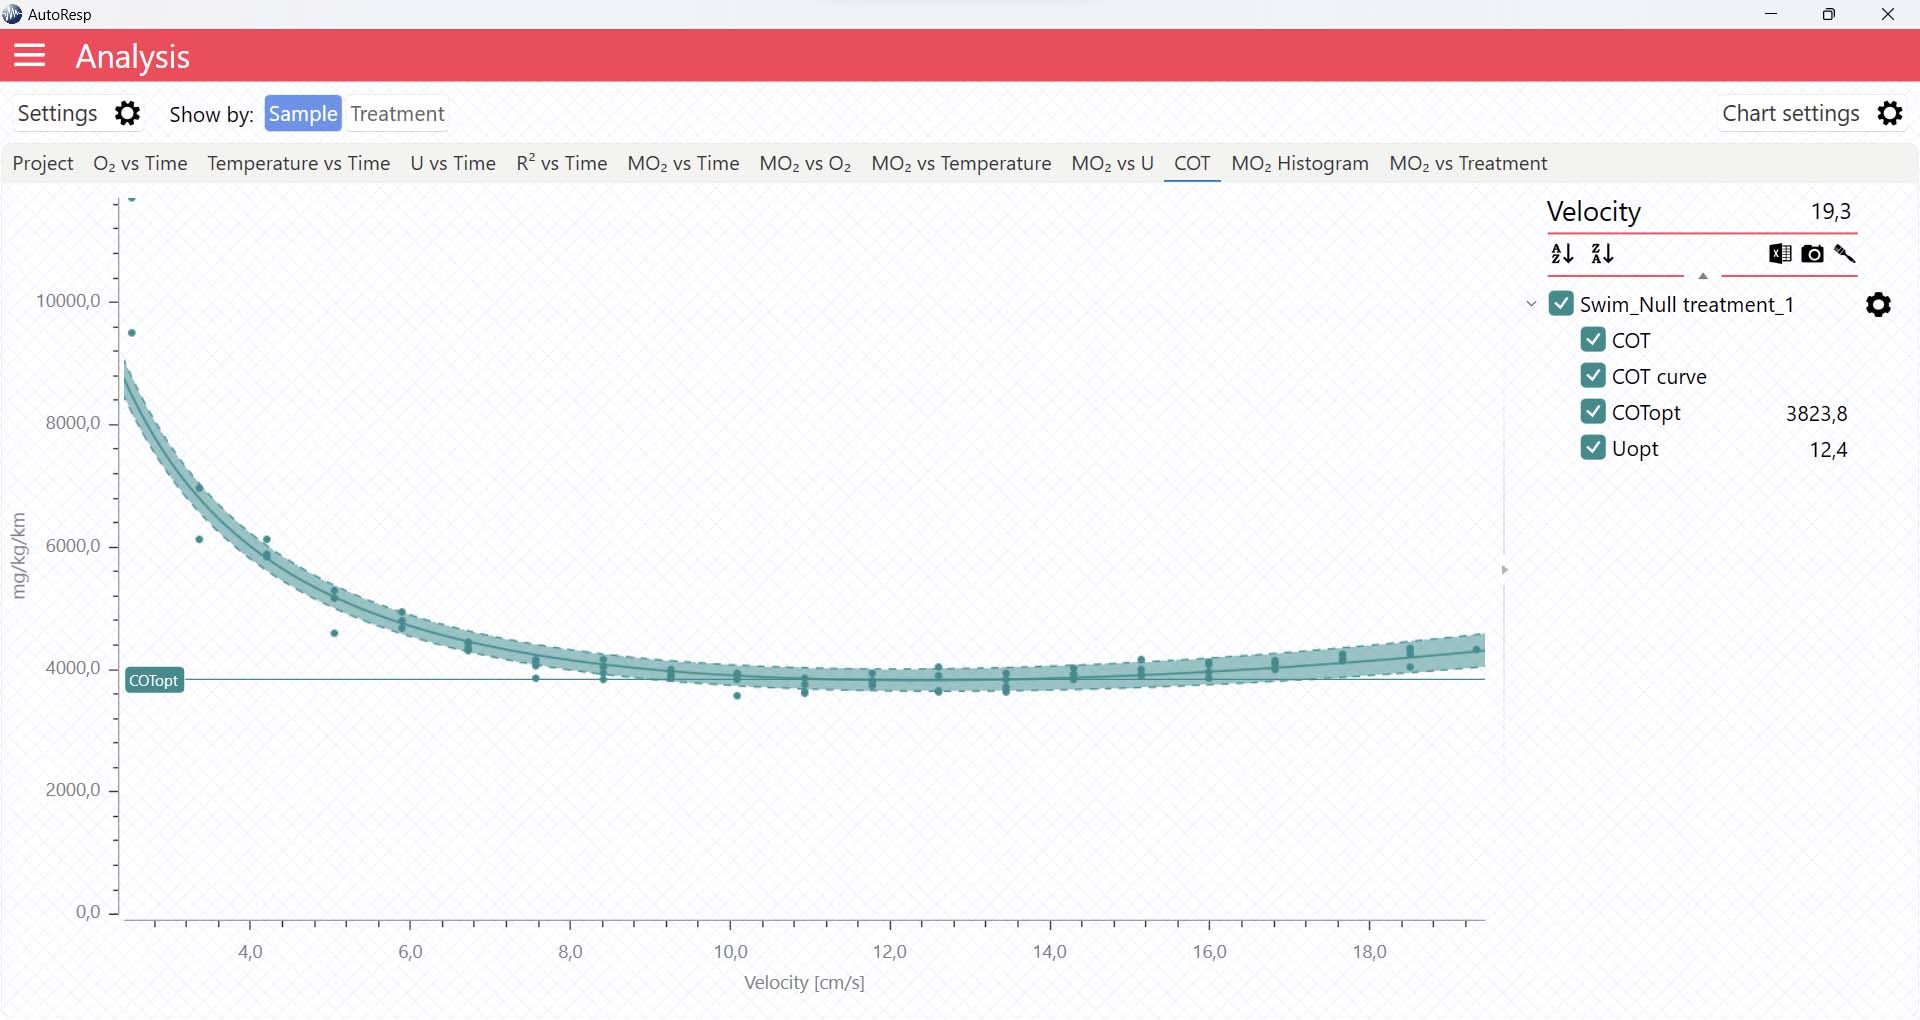
It is also in the COT tab that you can see the fitted function (COT curve) (and confidence interval, if enabled in the Chart settings menu), and the COTopt line and value. The COTopt is the COT value at the Optimal Swim Speed (Uopt):
The COT algorithms
For more details on the COT algorithms used in AutoResp™ v3, see the AutoResp™ 3 - Algorithms summary.
Setting data range for COT calculations
You can exclude MO2-values for each individual channel using the settings icon in the legend panel. Drag the blue handlers to set the range or input the values directly in the Start time and End time fields above:
A global data range (meaning it applies to all your analyzed data files) can be set in the Settings menu. Set the desired time interval or exclude data based on the R2-value:
AutoResp™ v3 – How to find the Optimal Swim Speed (Uopt)
Use AutoResp™ v3 to calculate Optimal Swim Speed (Uopt) values from your logged data files:
Main menu > Analysis > Project tab > Load a swim tunnel .ar3 file
Uopt graph
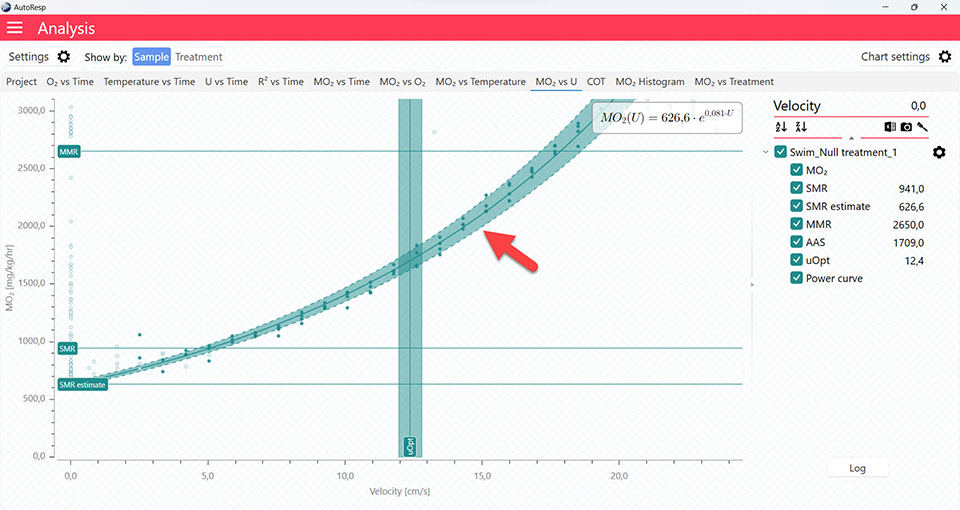
The COT and MO2 vs U tabs will give you graphs with a vertical line representing the Uopt line. The Uopt value is also shown in the legend panel, when you open the channel using the small arrow next to the colored checkbox. Multiple Uopt lines can be viewed by selecting multiple channels in the legend panel, but if you want to see the confidence interval for a specific Uopt line, only a single channel must be selected:
The Uopt algorithms
For more details on the Uopt algorithms used in AutoResp™ v3, see the AutoResp™ 3 - Algorithms summary.
Setting data range for Uopt calculations
You can exclude MO2-values for each individual channel using the settings icon in the legend panel. Drag the blue handlers to set the range or input the values directly in the Start time and End time fields above:
A global data range (meaning it applies to all your analyzed data files) can be set in the Settings menu. Set the desired time interval or exclude data based on the R2-value:
AutoResp™ v3 – How to find the Excessive Post-exercise Oxygen (EPOC)
Use AutoResp™ v3 to calculate Excessive Post-exercise Oxygen (EPOC) values from your logged data files:
Main menu > Analysis > Project tab > Load a swim tunnel or resting chamber .ar3 file
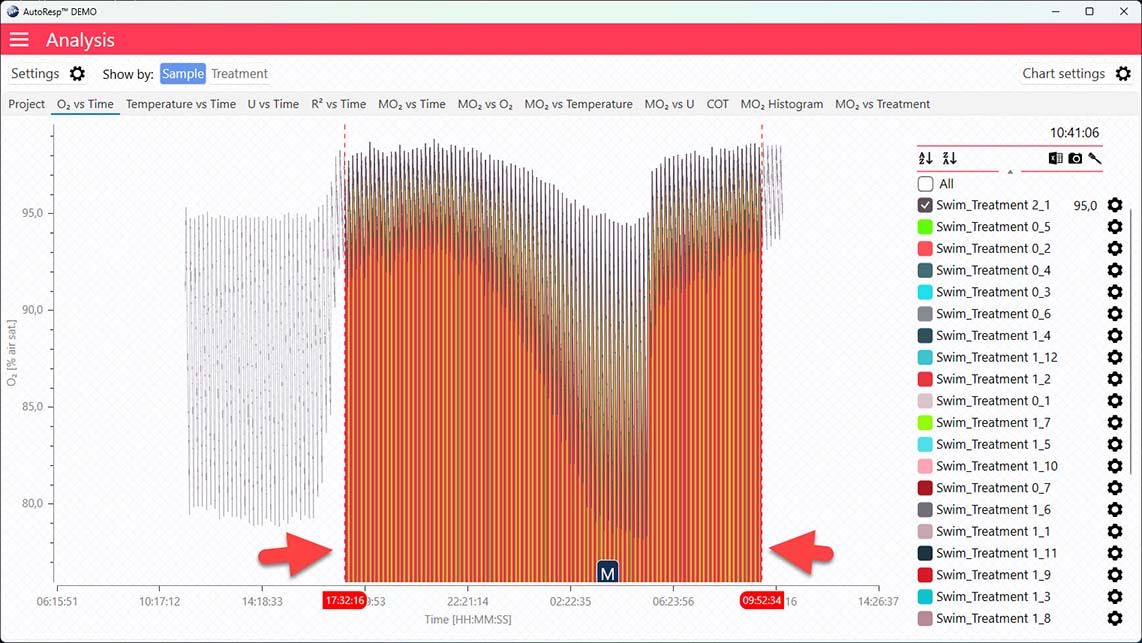
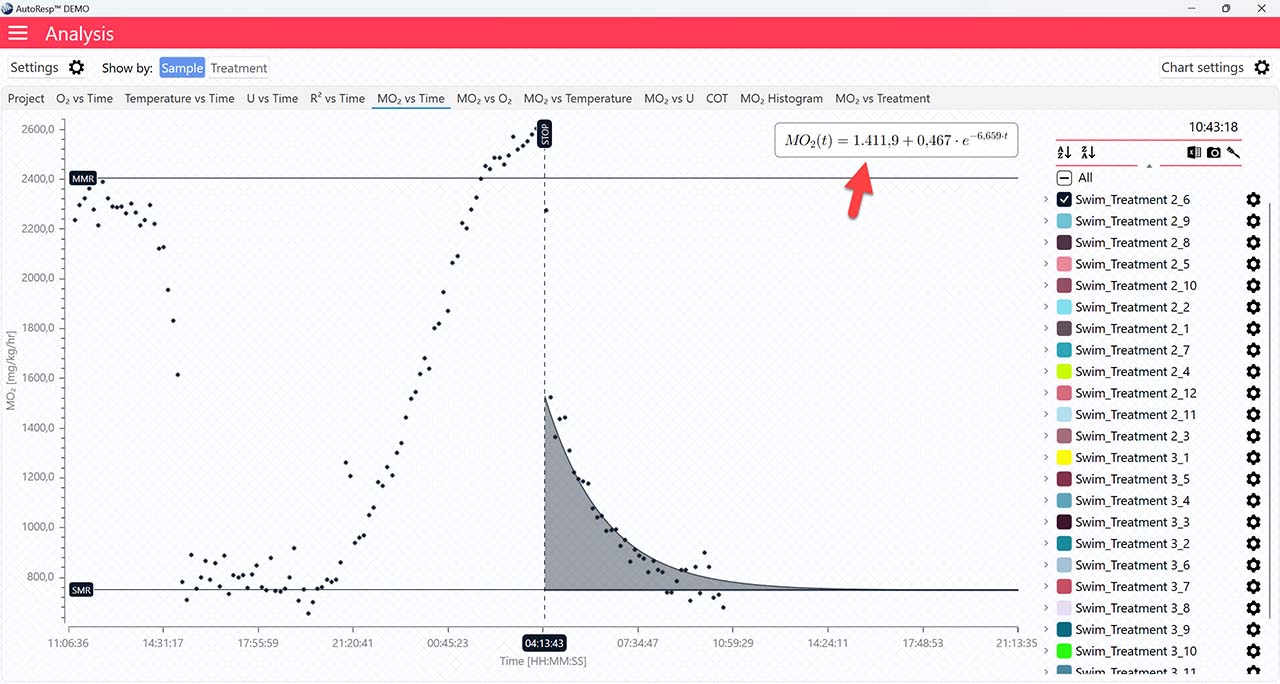
EPOC graph
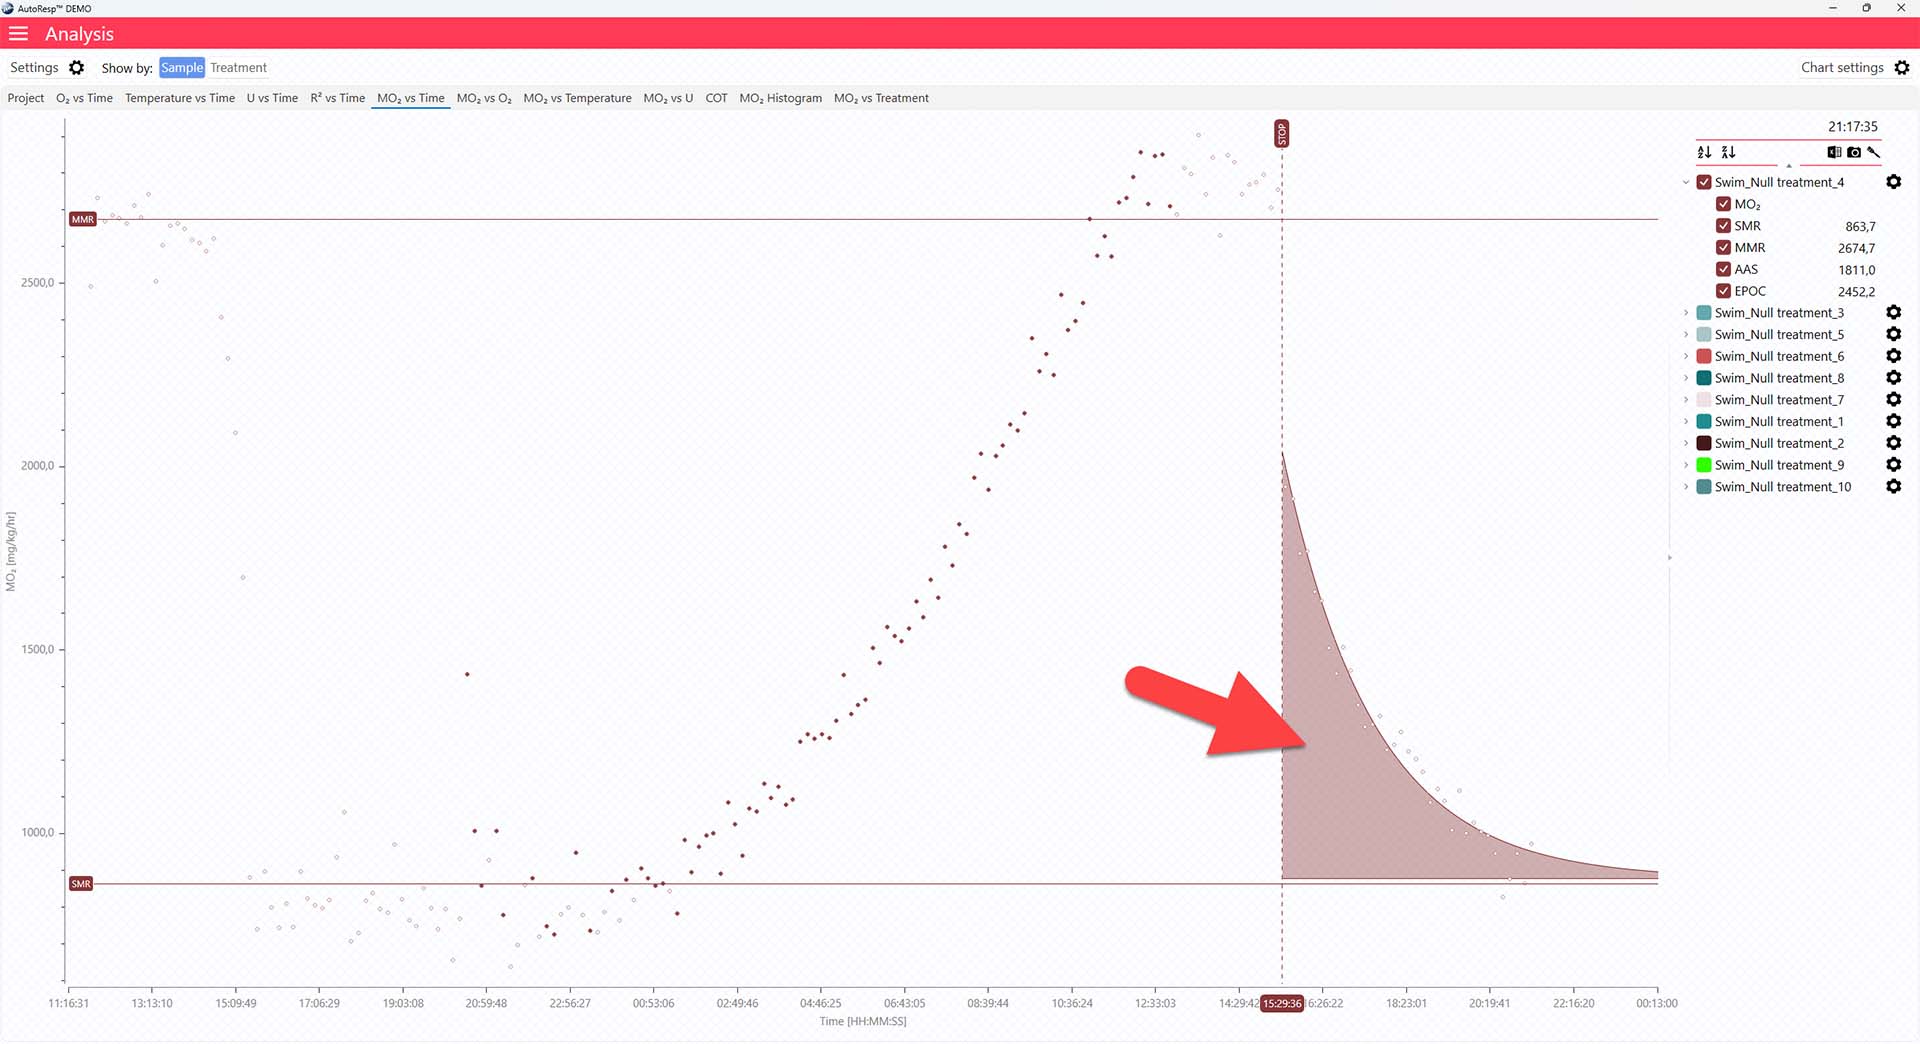
The MO2 vs Time tab will give you a graph of EPOC as the colored area after the dotted, vertical STOP line. The EPOC value is also shown in the legend panel, when you open the channel using the small arrow next to the colored checkbox. Note that only a single EPOC area can be shown at a time:
The EPOC algorithms
You can change the method used to calculate and show the EPOC value in the Settings menu > EPOC tab. For more details on the EPOC algorithms used in AutoResp™ v3, see the AutoResp™ 3 - Algorithms summary.
Setting data range for EPOC calculations
You can exclude MO2-values for each individual channel using the settings icon in the legend panel. Drag the blue handlers to set the range or input the values directly in the Start time and End time fields above:
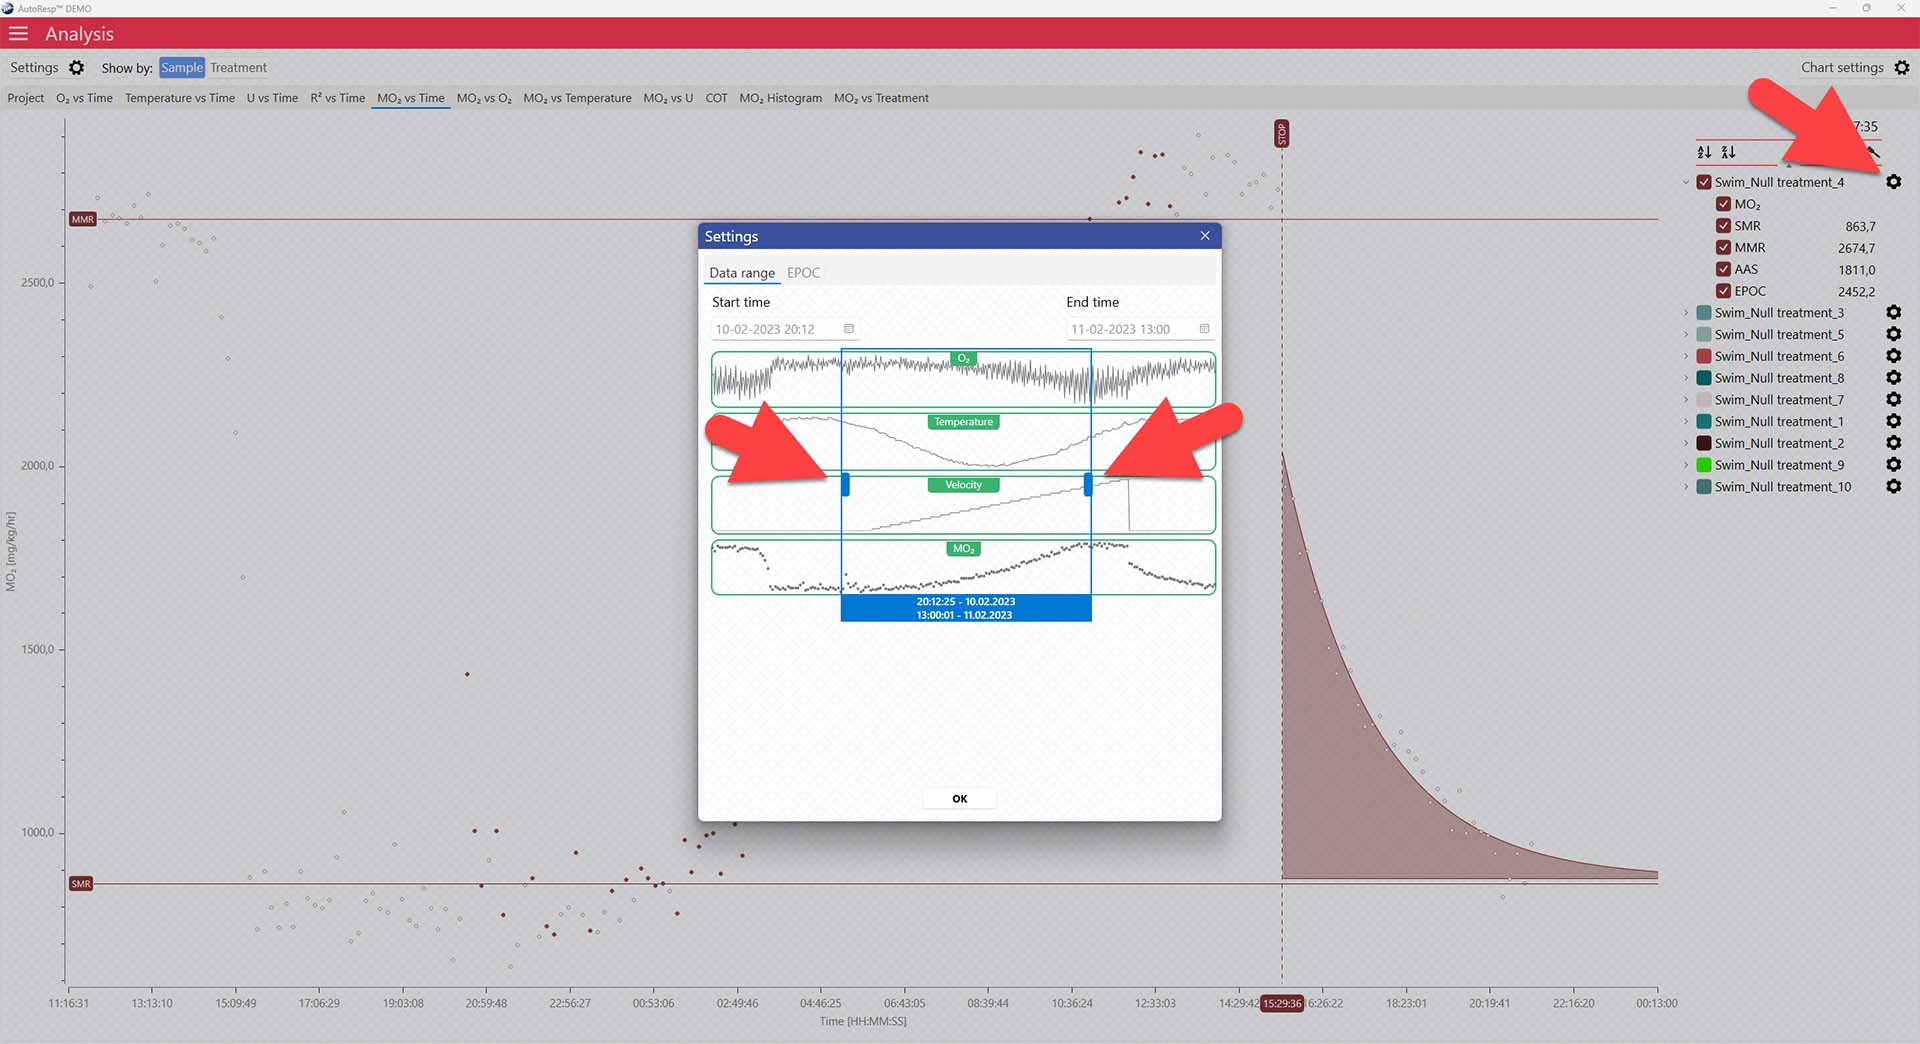
A global data range (meaning it applies to all your analyzed data files) can be set in the Settings menu. Set the desired time interval or exclude data based on the R2-value:
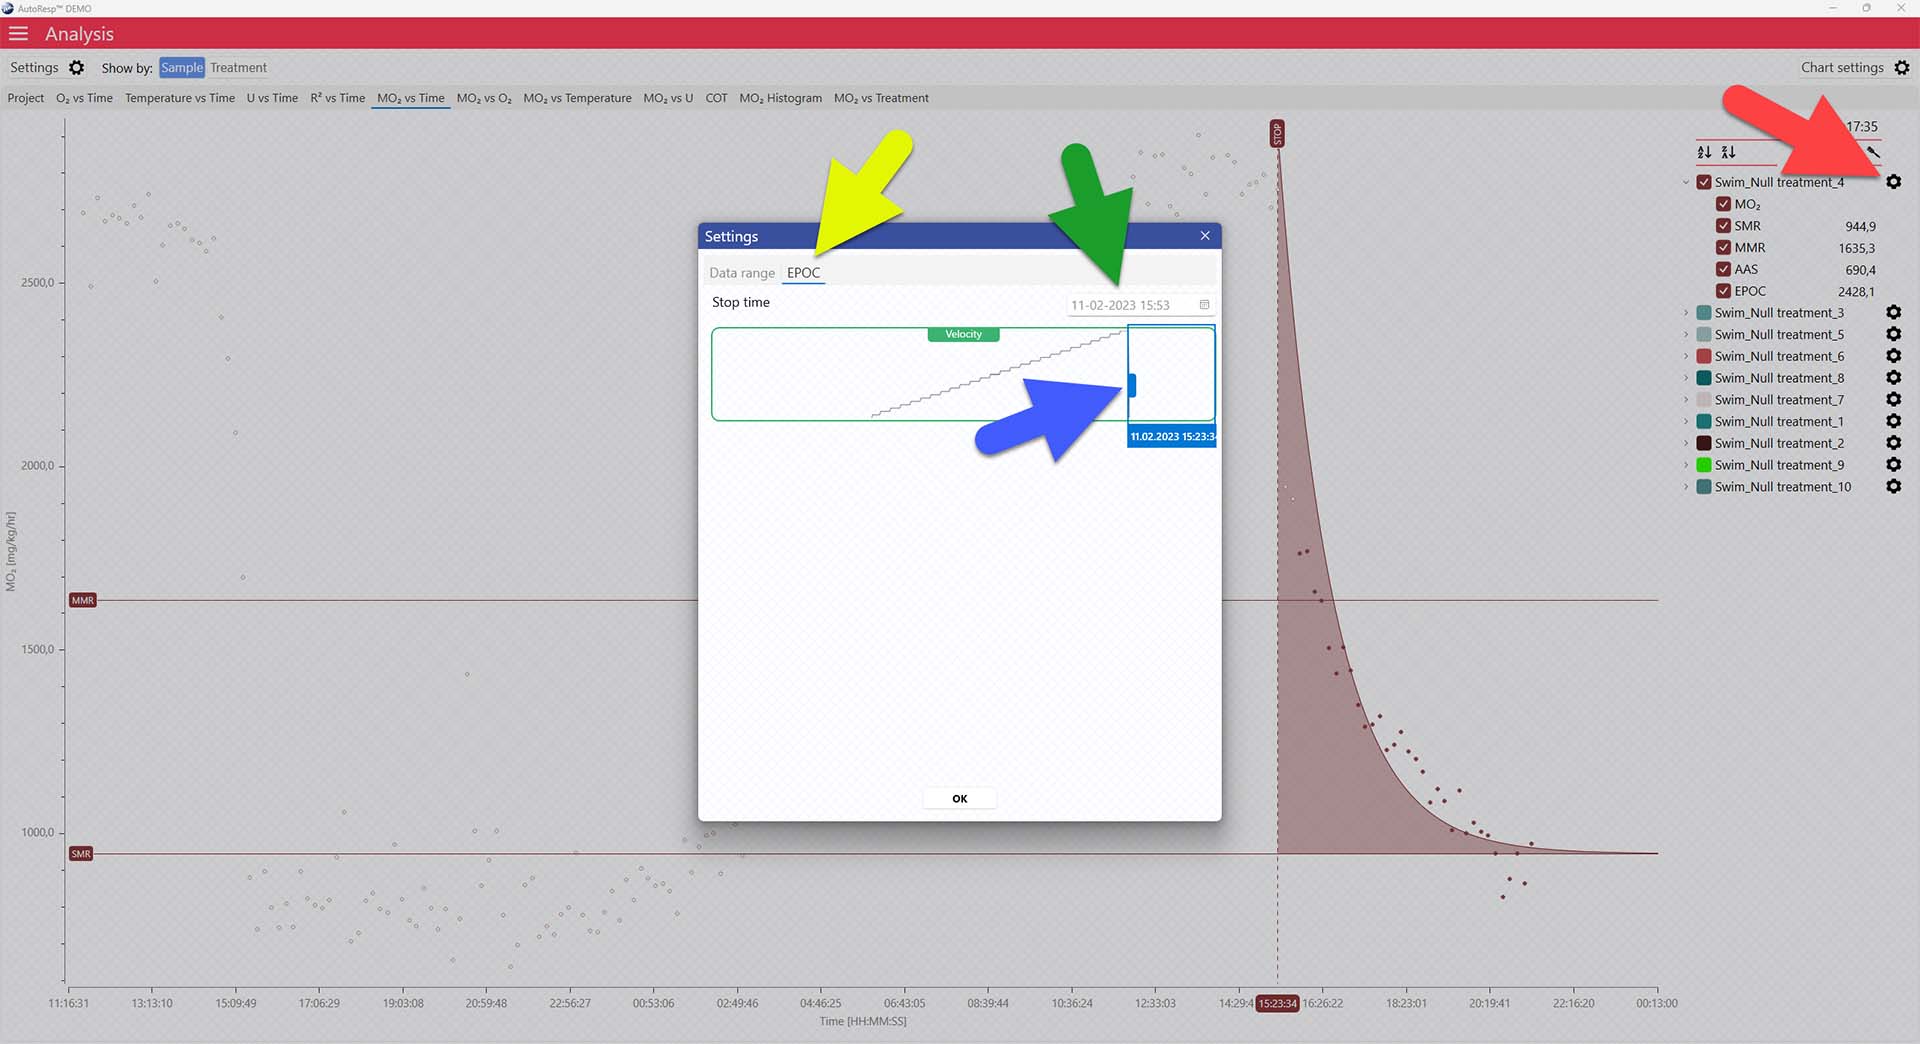
The dotted STOP line can be adjusted via the settings icon in the legend panel for each channel (red arrow). Open the EPOC tab (yellow arrow) and click og drag the blue handle (blue arrow) to place the stop value. The exact STOP line value can also be typed in using the Stop time field (green arrow):
AutoResp™ v3 – How to normalize MO2 to a specific weight (allometric scaling)
Use AutoResp™ v3 to normalize MO2 values to a specific weight (allometric scaling) from your logged data files:
Main menu > Analysis > Project tab > Load a swim tunnel or resting chamber .ar3 file
In the Project tab, open the Settings menu > Allometric scaling tab > Set enable to yes
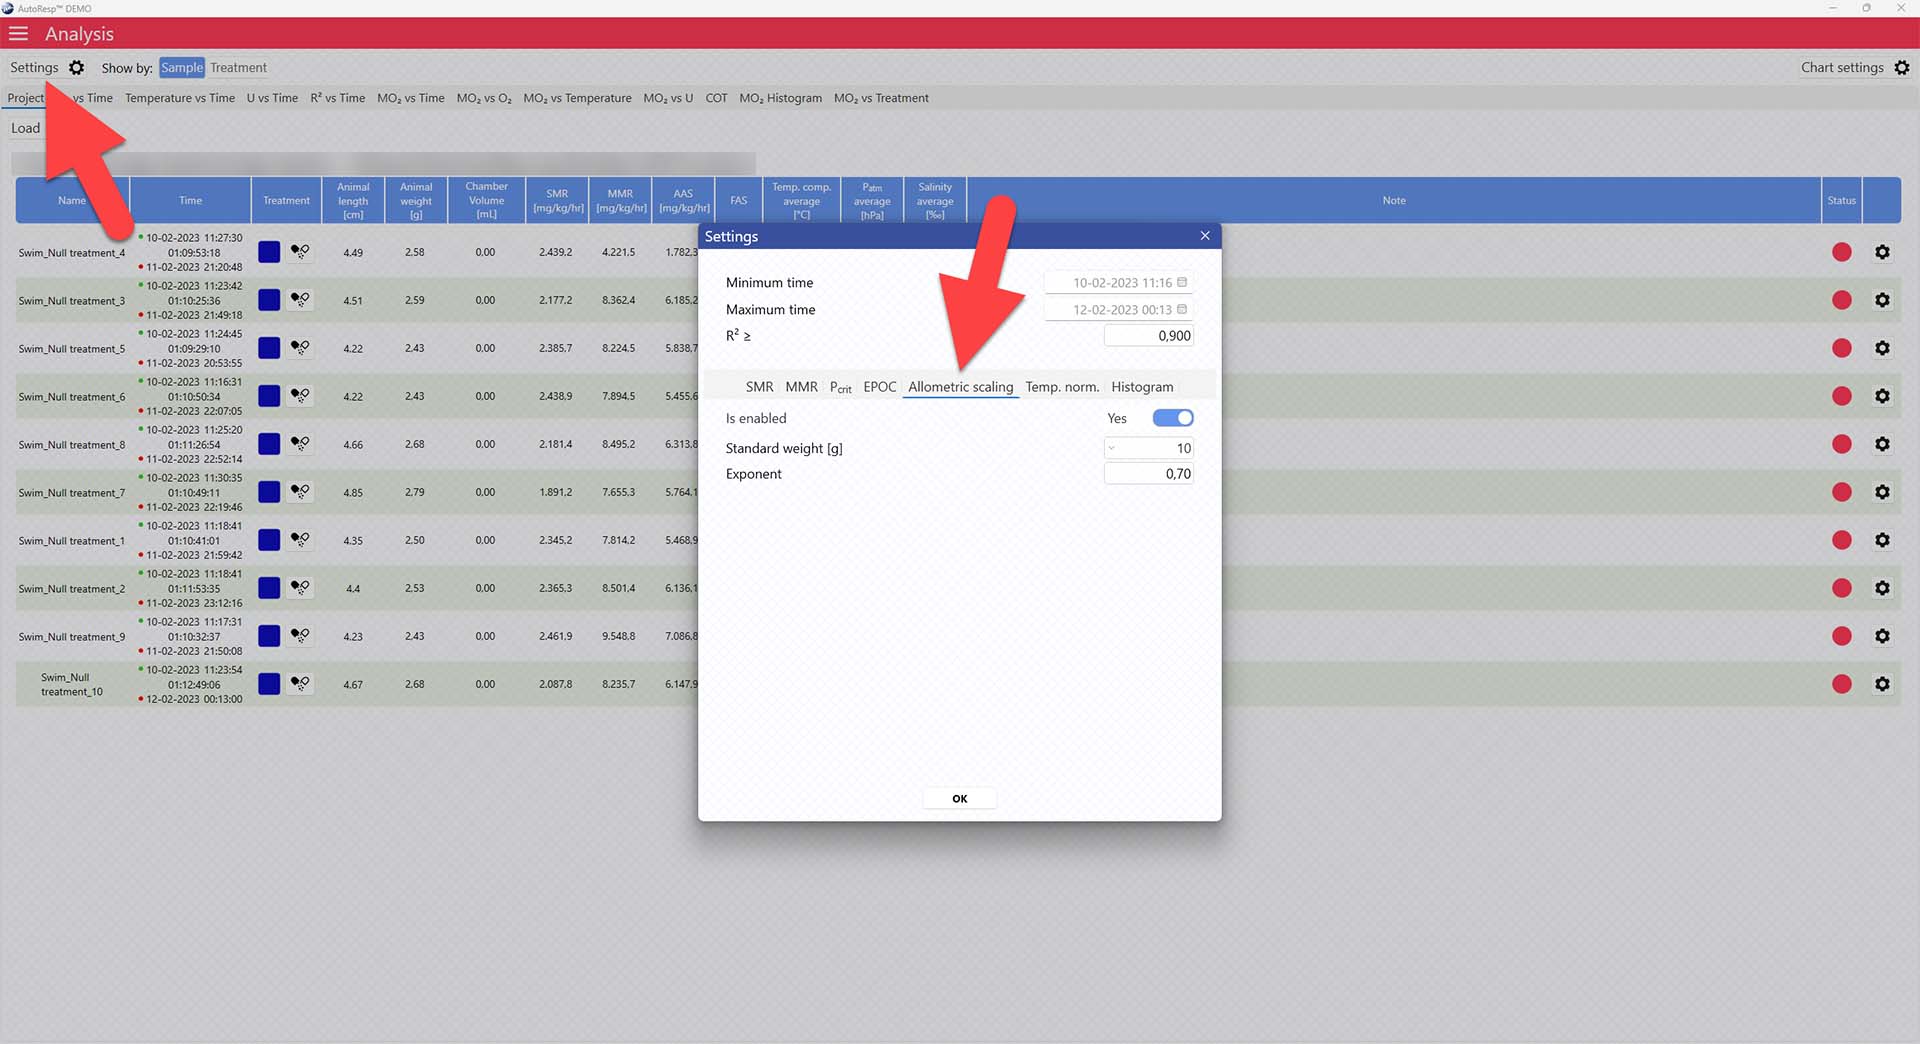
Now adjust the standard weight you want to normalize to, and change the exponent, if necessary, in the parameters below.
The allometric scaling algorithms
For more details on the allometric scaling algorithms used in AutoResp™ v3, see the AutoResp™ 3 - Algorithms summary.
LinkAutoResp™ v3 – How to normalize MO2 to a specific temperature (Temp.norm.)
Use AutoResp™ v3 to normalize MO2 values to a specific temperature (Tempnorm) from your logged data files:
Main menu > Analysis > Project tab > Load a swim tunnel or resting chamber .ar3 file
In the Project tab, open the Settings menu > Temp. norm. tab > Set enable to yes
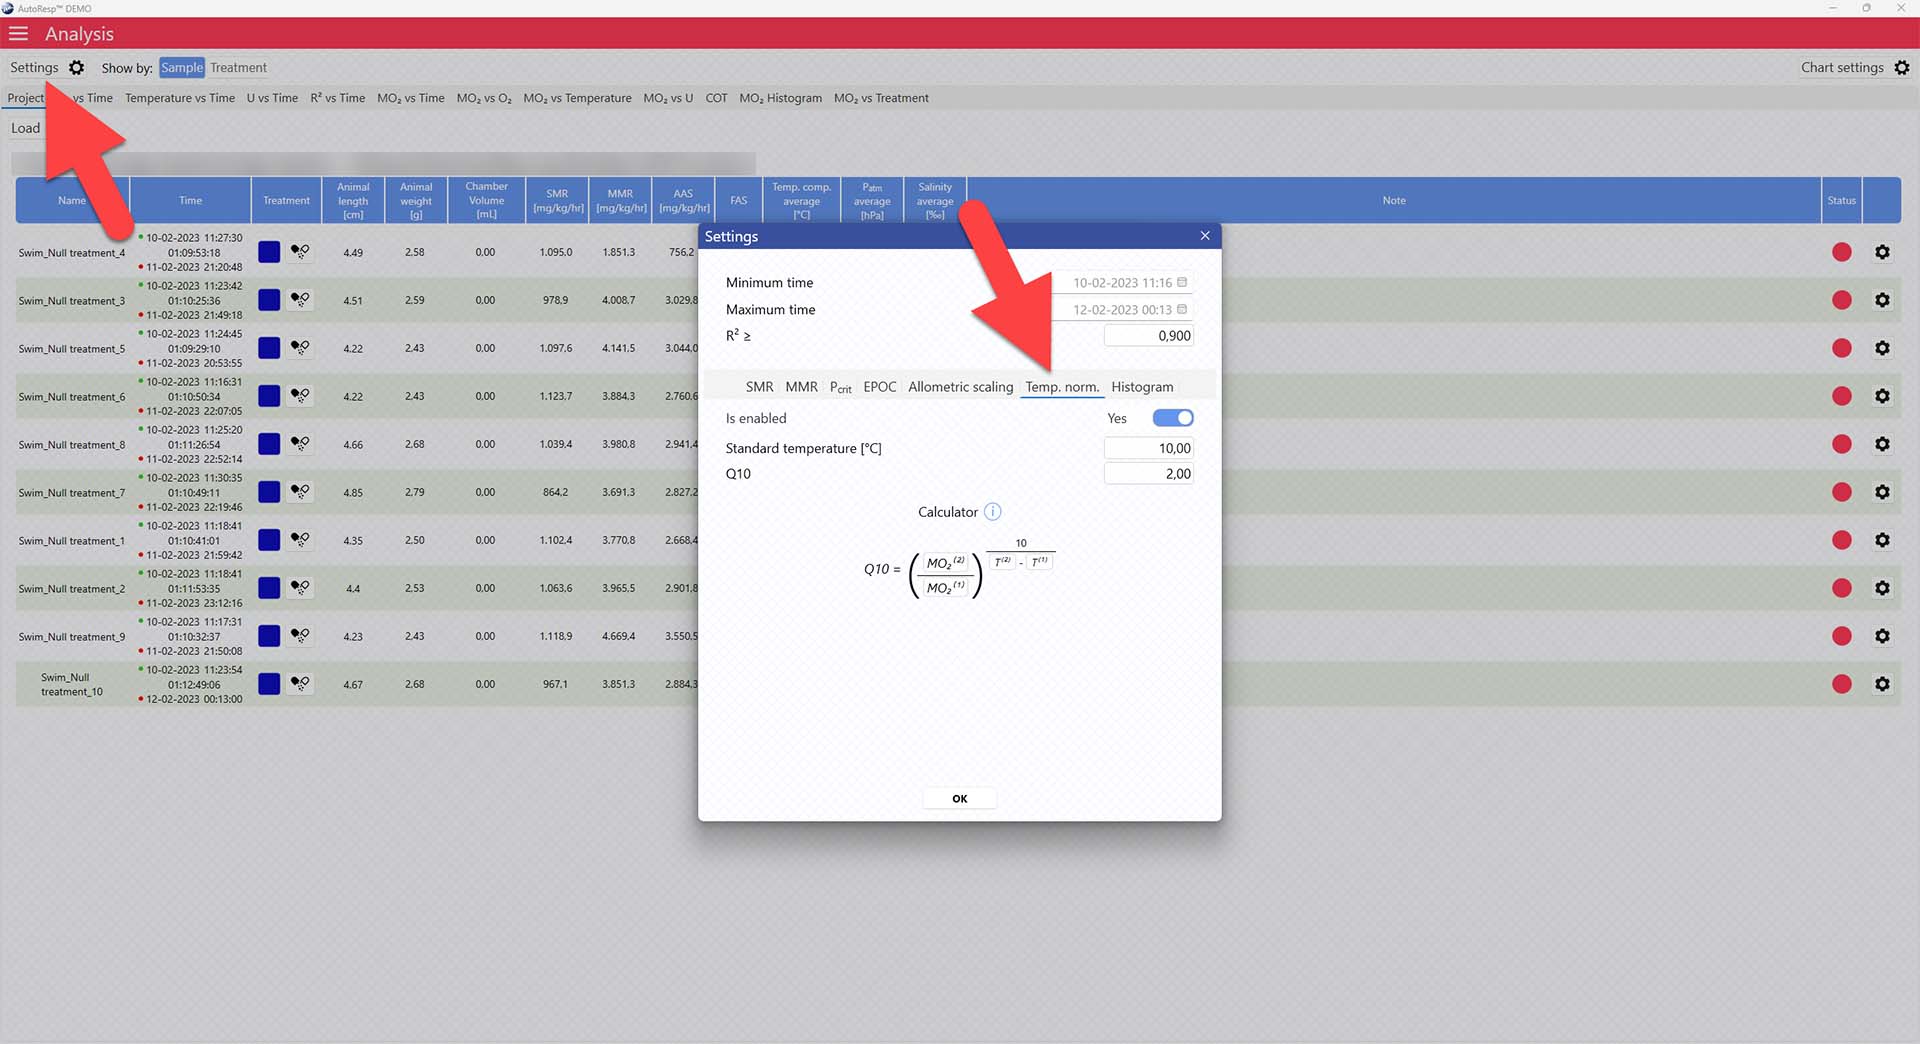
Now adjust the standard temperature you want to normalize to, and change the Q10 value, if necessary, in the parameters below. The Q10 value can be entered directly, or you can enter the individual parameters in the function below.
The Tempnorm algorithms
For more details on the Tempnorm algorithms used in AutoResp™ v3, see the AutoResp™ 3 - Algorithms summary.
LinkAutoResp™ v3 – How to apply solid blocking correction
What is solid blocking
In a closed swim tunnel a solid object will change the velocity of the flowing water. This effect is known as solid blocking, which is something we can compensate for based on the work by Bell, W.H. & Terhune, L.D.B. (1970).
The full formula can be found in the Autoresp 3 - Algorithms summary (link)
In brief, the formula works by calculating a correction factor based on a number of parameters:
- Length of the fish
- Radius of the fish
- Shape of the fish
- Cross-sectional area of the fish
- Cross-sectional area of the swim tunnel
Taken together, we can calculate a fractional error which we can multiply the measured swim speed by to get the corrected swimming speed.
In Autoresp, the fractional error can be applied in two ways: you can enter it manually, or you can have Autoresp compute it automatically using your fish’s measurements.
Autoresp then uses this value to correct the water velocity, i.e., it reduces the motor RPM so that the actual water velocity inside the test section matches the target swimming speed you defined for your experiment.